View and configure Azure DDoS protection telemetry
Azure DDoS Protection offers in-depth insights and visualizations of attack patterns through DDoS Attack Analytics. It provides customers with comprehensive visibility into attack traffic and mitigation actions via reports and flow logs. During a DDoS attack, detailed metrics are available through Azure Monitor, which also allows alert configurations based on these metrics.
In this tutorial, you'll learn how to:
- View Azure DDoS Protection telemetry
- View Azure DDoS Protection mitigation policies
- Validate and test Azure DDoS Protection telemetry
If you don't have an Azure subscription, create a free account before you begin.
Prerequisites
- If you don't have an Azure subscription, create a free account before you begin.
- Before you can complete the steps in this tutorial, you must first create a DDoS simulation attack to generate the telemetry. Telemetry data is recorded during an attack. For more information, see Test DDoS Protection through simulation.
View Azure DDoS Protection telemetry
Telemetry for an attack is provided through Azure Monitor in real time. While mitigation triggers for TCP SYN, TCP & UDP are available during peace-time, other telemetry is available only when a public IP address has been under mitigation.
You can view DDoS telemetry for a protected public IP address through three different resource types: DDoS protection plan, virtual network, and public IP address.
Logging can be further integrated with Microsoft Sentinel, Splunk (Azure Event Hubs), OMS Log Analytics, and Azure Storage for advanced analysis via the Azure Monitor Diagnostics interface.
For more information on metrics, see Monitoring Azure DDoS Protection for details on DDoS Protection monitoring logs.
View metrics from DDoS protection plan
- Sign in to the Azure portal and select your DDoS protection plan.
- On the Azure portal menu, select or search for and select DDoS protection plans then select your DDoS protection plan.
- Under Monitoring, select Metrics.
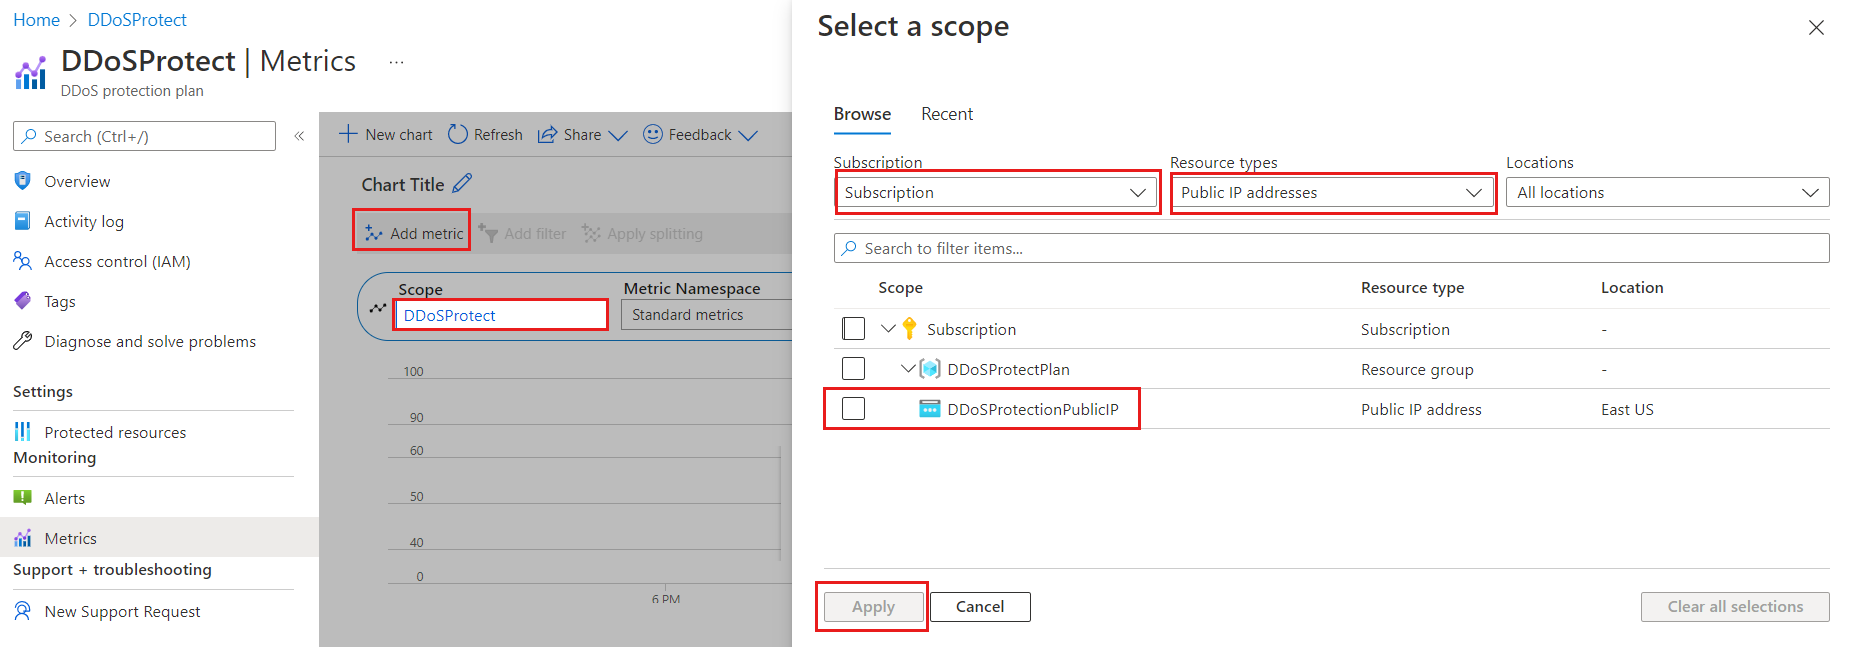
- Select Add metric then select Scope.
- In the Select a scope menu, select the Subscription that contains the public IP address you want to log.
- Select Public IP Address for Resource type then select the specific public IP address you want to log metrics for, and then select Apply.
- For Metric select Under DDoS attack or not.
- Select the Aggregation type as Max.
View metrics from virtual network
- Sign in to the Azure portal and browse to your virtual network that has DDoS protection enabled.
- Under Monitoring, select Metrics.
- Select Add metric then select Scope.
- In the Select a scope menu, select the Subscription that contains the public IP address you want to log.
- Select Public IP Address for Resource type then select the specific public IP address you want to log metrics for, and then select Apply.
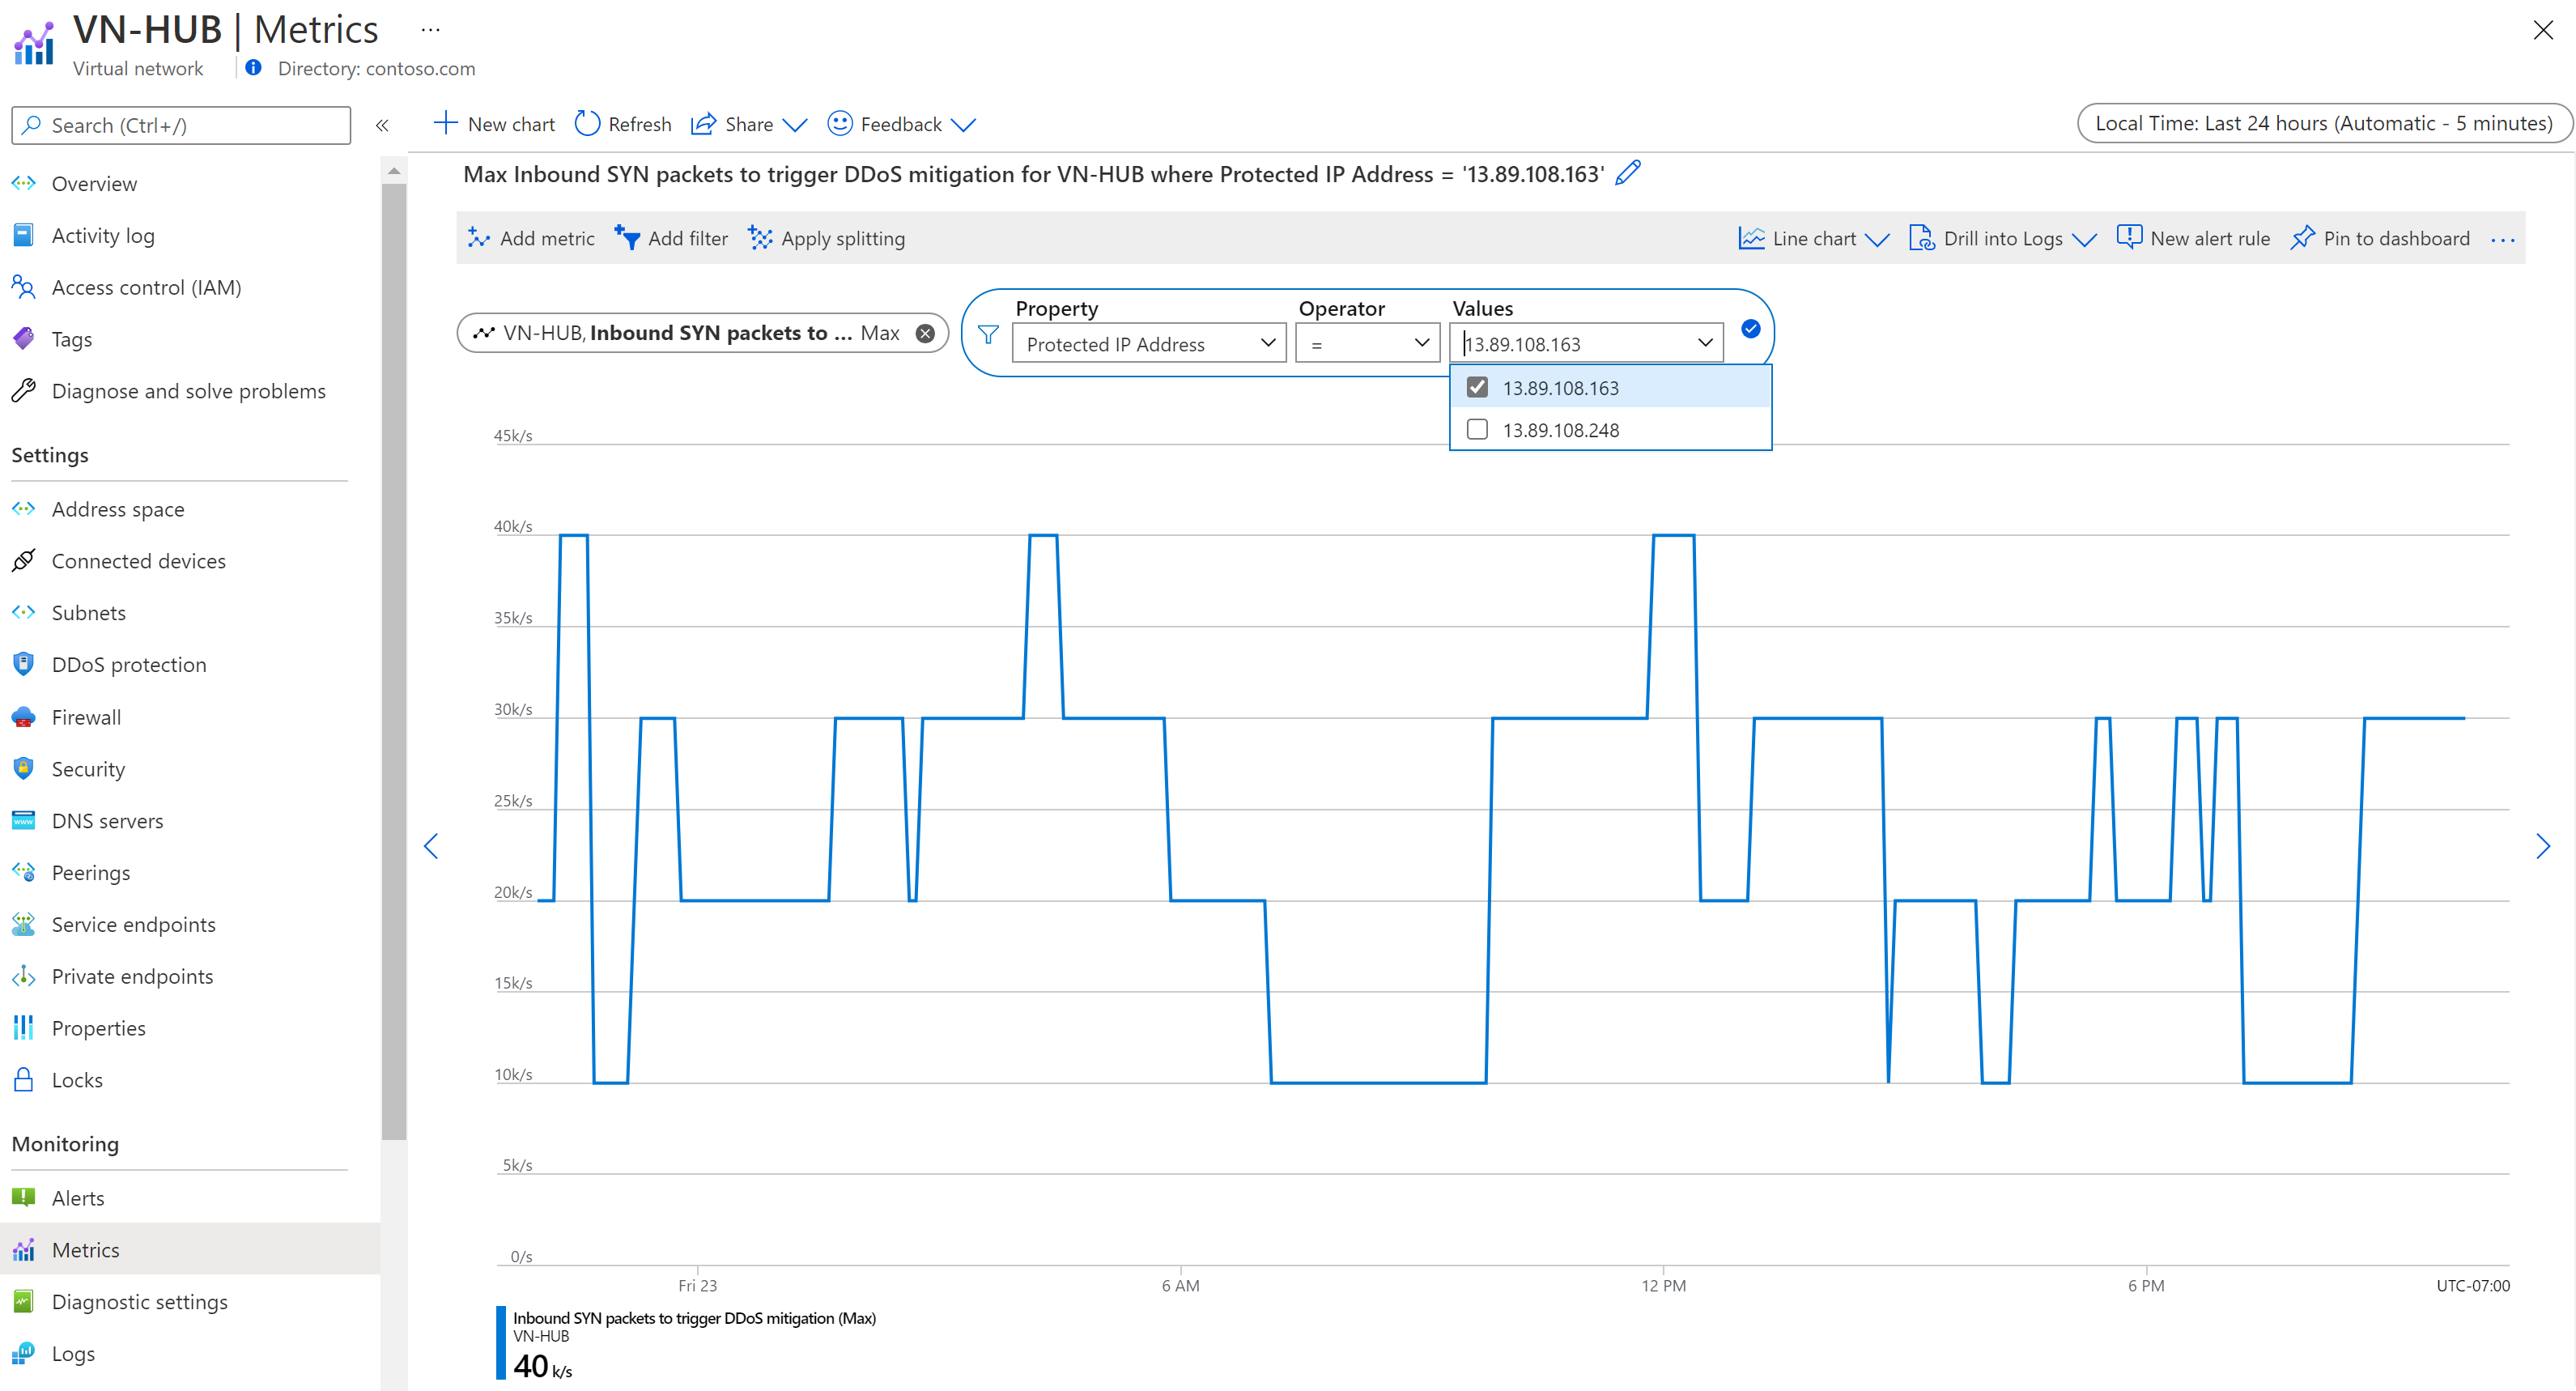
- Under Metric select your chosen metric then under Aggregation select type as Max.
View metrics from Public IP address
- Sign in to the Azure portal and browse to your public IP address.
- On the Azure portal menu, select or search for and select Public IP addresses then select your public IP address.
- Under Monitoring, select Metrics.
- Select Add metric then select Scope.
- In the Select a scope menu, select the Subscription that contains the public IP address you want to log.
- Select Public IP Address for Resource type then select the specific public IP address you want to log metrics for, and then select Apply.
- Under Metric select your chosen metric then under Aggregation select type as Max.
View DDoS mitigation policies
Azure DDoS Protection uses three automatically adjusted mitigation policies (TCP SYN, TCP, and UDP) for each public IP address of the resource being protected. This applies to any virtual network with DDoS protection enabled.
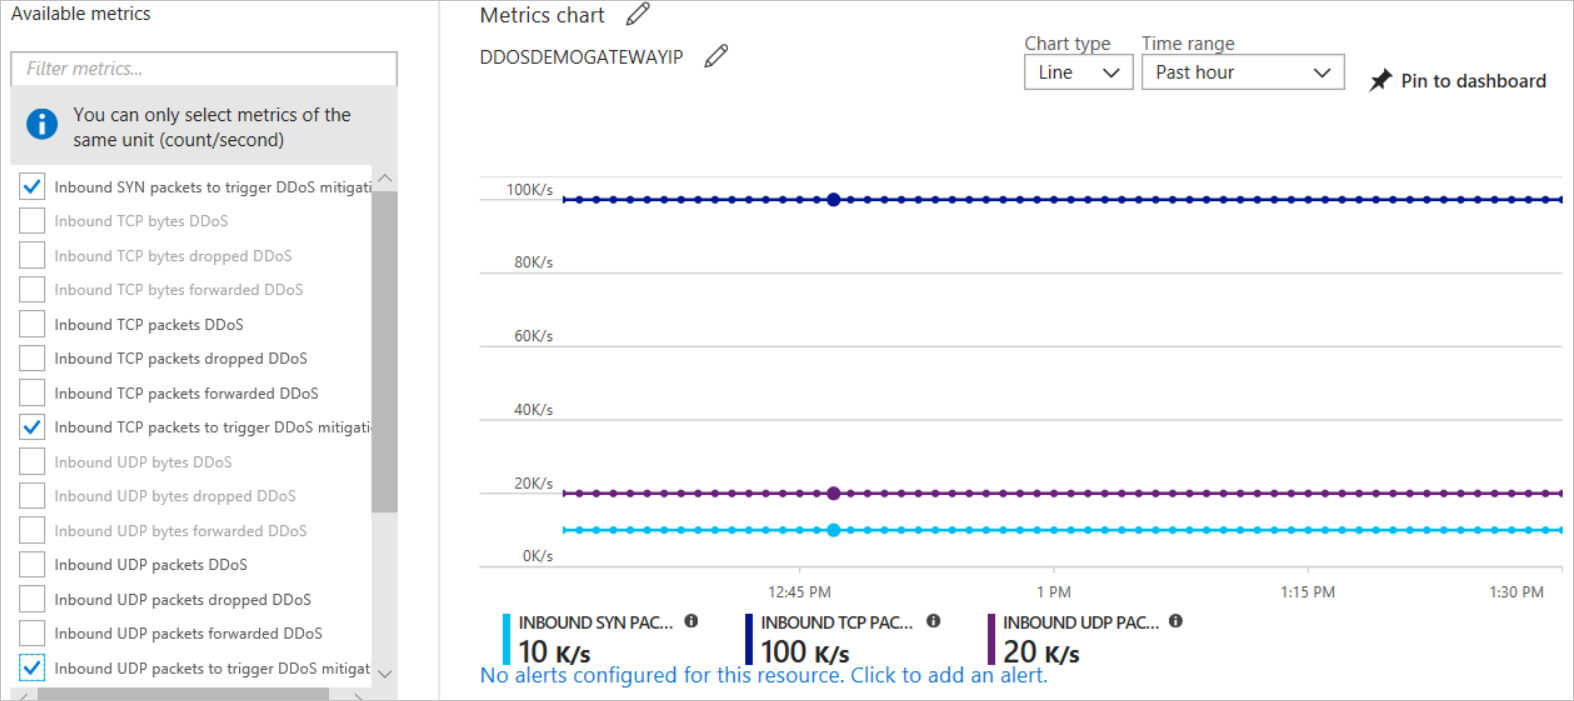
You can see the policy limits within your public IP address metrics by choosing the Inbound SYN packets to trigger DDoS mitigation, Inbound TCP packets to trigger DDoS mitigation, and Inbound UDP packets to trigger DDoS mitigation metrics. Make sure to set the aggregation type to Max.
View peace time traffic telemetry
It's important to keep an eye on the metrics for TCP SYN, UDP, and TCP detection triggers. These metrics help you know when DDoS protection starts. Make sure these triggers reflect the normal traffic levels when there's no attack.
You can make a chart for the public IP address resource. In this chart, include the Packet Count and SYN Count metrics. The Packet count includes both TCP and UDP Packets. This shows you the sum of traffic.


No comments:
Post a Comment