Amazon CloudWatch is a service used for monitoring and observing resources in real-time, built for DevOps engineers, developers, site reliability engineers (SREs), and IT managers. CloudWatch provides users with data and actionable insights to monitor their respective applications, stimulate system-wide performance changes, and optimize resource utilization. CloudWatch collects monitoring and operational data in the form of logs, metrics, and events, providing its users with an aggregated view of AWS resources, applications, and services that run on AWS. The CloudWatch can also be used to detect anomalous behavior in the environments, set warnings and alarms, visualize logs and metrics side by side, take automated actions and troubleshoot issues.
Terminologies related to Amazon Cloudwatch
Metrics
- It represents a time-ordered set of data points that are published to Amazon CloudWatch
- All data point is marked with a timestamp
- Metric is a variable that is monitored and data points are the value of that variable over time
- They are uniquely defined by a name, namespace, and zero or more dimensions
- Metric math is used to query multiple cloudwatch metrics and use math expressions to create new time-series based on these metrics
Dimensions
- A dimension is a name/value pair which uniquely identifies a metric
- Dimensions are the unique identifiers for a metric, so whenever you add a unique name/value pair to one of the metrics, you are creating a new variation of that metric.
Statistics
- Statistics are metric data aggregations over specified periods of time
- The few available statistics on Cloudwatch are maximum, minimum, sum, average, and sample count.
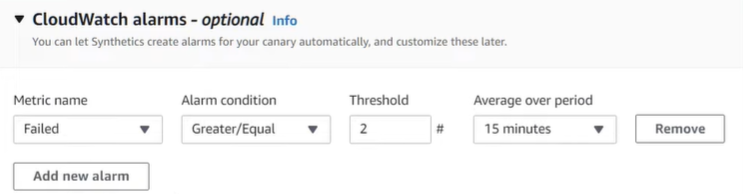
Alarm
- It is used to automatically initiate actions on our behalf
- It watches a single metric over a specified time period and performs one or more specified actions based on the value of the metric
- The estimated AWS charges can also be monitored using the alarm
Percentiles
- It represents the relative weightage of the data in a dataset
- It helps the user to get a better understanding of the distribution of metric data
Cloudwatch dashboard
- A user-friendly Cloudwatch console is available which is used for monitoring resources in a single view.
- There is no limit on the number of cloudwatch dashboards you can create.
- These dashboards are global and not region-specific
Cloudwatch agent
- It is required to be installed
- It collects logs and system-level metrics from EC2 instances and on-premises servers
Cloudwatch Events:
- Cloudwatch events help you to create a set of rules that match with any event(i.e stopping of EC2 instance).
- These events can be routed to one or more targets like AWS Lambda functions, Amazon SNS Topics, Amazon SQS queues, and other target types.
- Cloudwatch Events observes the operational events continuously and whenever there is any change in the state of the event, it performs the action by sending notifications, activating lambda, etc.
- An event indicates a change in the AWS environment. Whenever there is a change in the state of AWS resources, events are generated.
- Rules are used for matching events and routing to targets.
- Target process events. They include Amazon EC2 instances, AWS Lambda functions, etc. A target receives the events in JSON format.
Cloudwatch logs:
- Amazon Cloudwatch logs enable you to store, monitor, and access files from AWS resources like Amazon EC2 instances, Route53, etc.
- It also helps you to troubleshoot your system errors and maintain the logs in highly durable storage.
- It also creates log of information about the DNS queries that Route 53 receives
Amazon Cloudwatch Create
Notifying gfg website management team when the instance on which gfg website is hosted stops Whenever the CPU utilization of instance (on which GeeksForGeeks website is hosted ) goes above 80%, cloudwatch event is triggered. This cloudwatch event then activates the SNS topic which sends the alert email to the attached gfg subscribers.
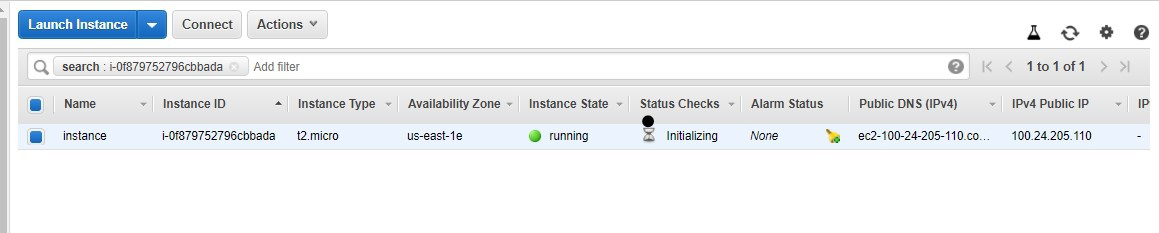
Step 1: Let us assume that you have already launched an instance with the name tag ‘instance’.
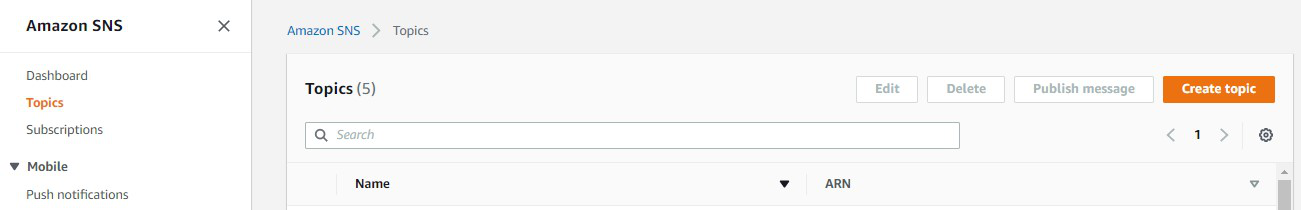
Step 2: Go to SNS topic dashboard and click on create a topic
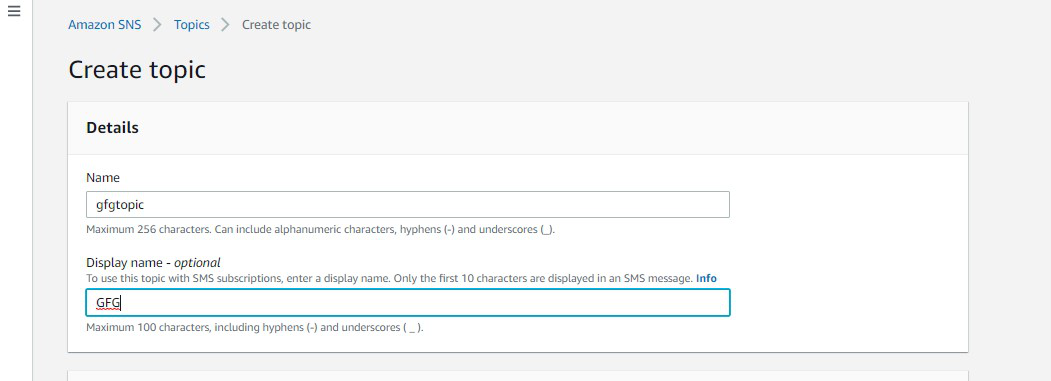
Step 3: You will be directed to this dashboard. Now specify the name and display name.
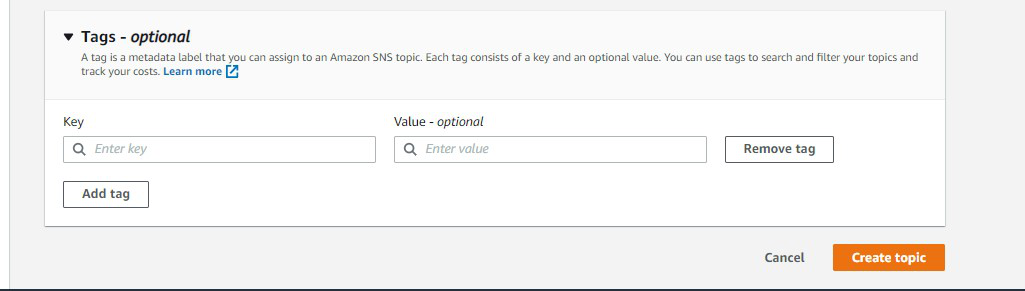
Step 4: Scroll down and click on create the topic.
Step 5: The SNS topic is created successfully.
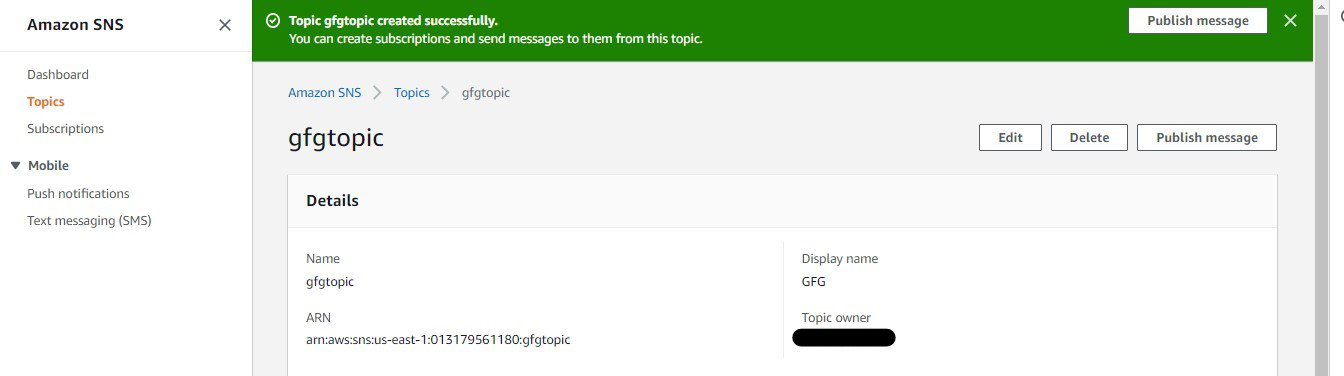
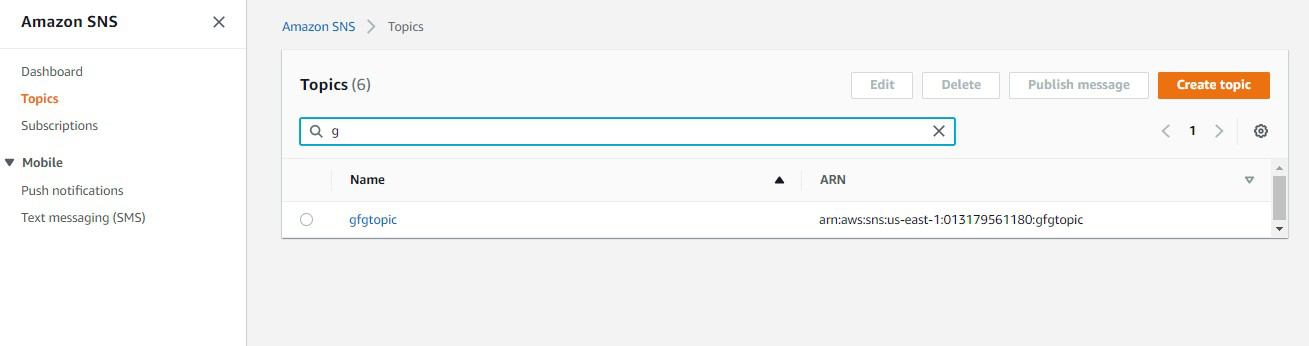
Step 6: Go to the SNS topic dashboard and click on gfgtopic link.
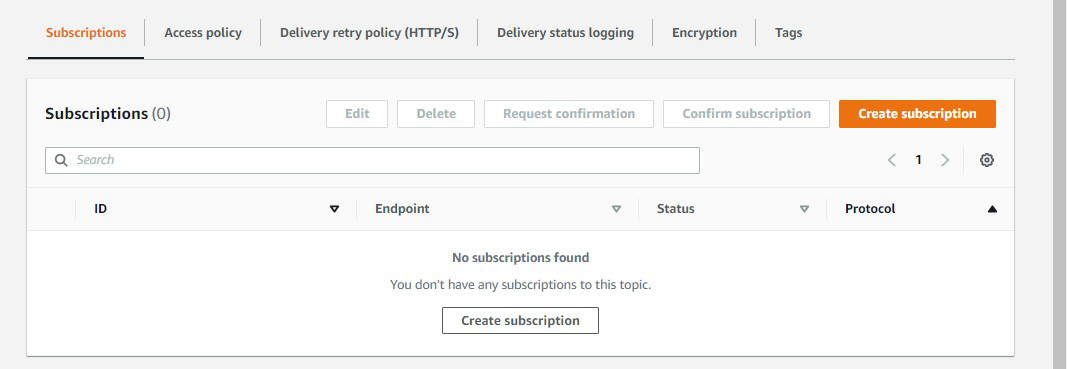
Step 7: Under the subscriptions section, Click on Create subscription.
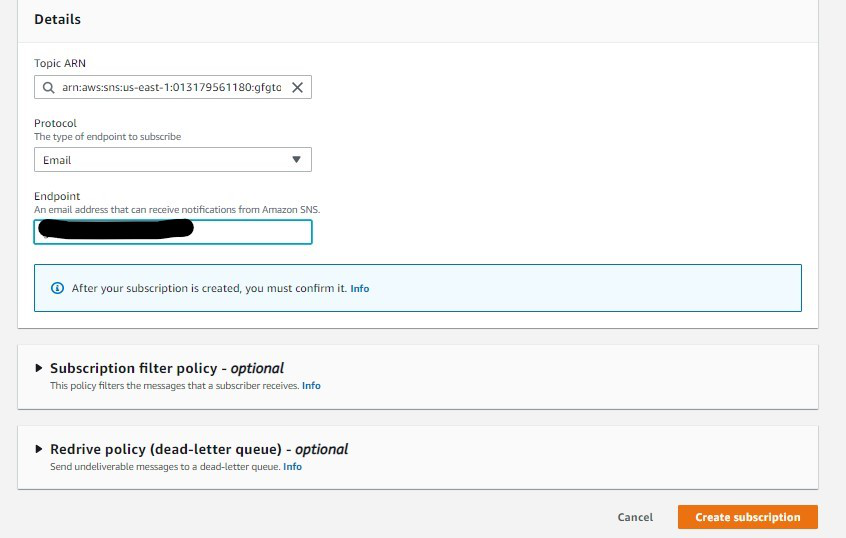
Step 8: Select Email as protocol and specify the email address of subscribers in Endpoint. Click on create the subscription. Now Go to the mailbox of the specified email id and click on Subscription confirmed.
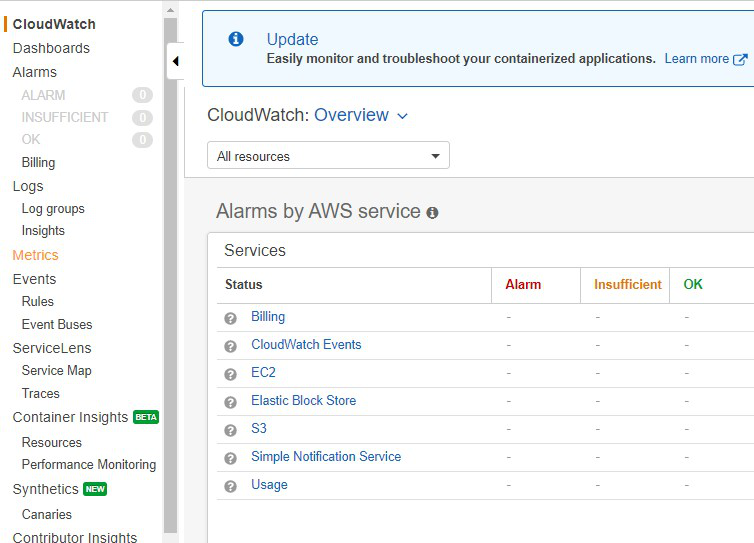
Step 9: Go to the cloudwatch dashboard on the AWS management console. Click on Metrics in the left pane.
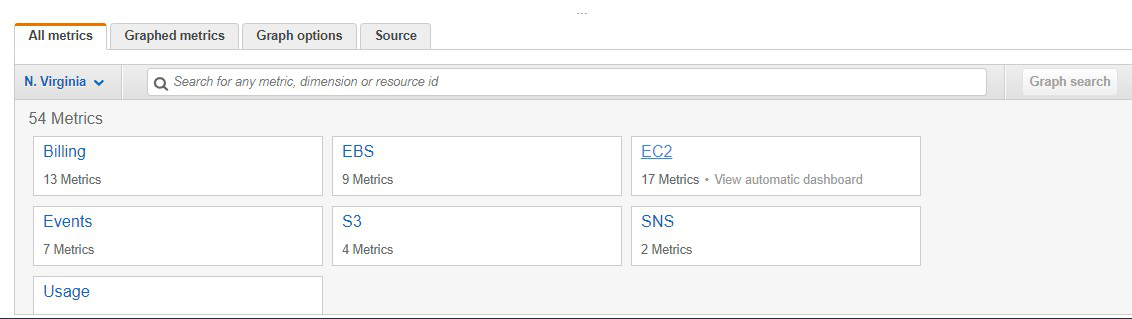
Step 10: In All metrics section click on EC2
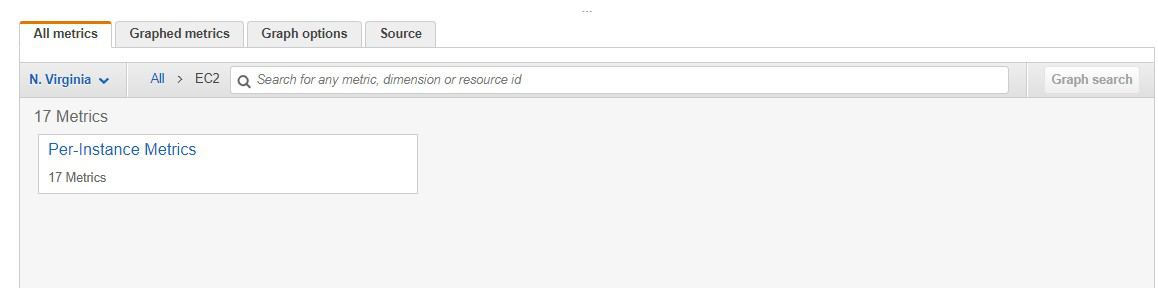
Step 11: Click on Per-instance metrics
Step 12: Select the instance you launched
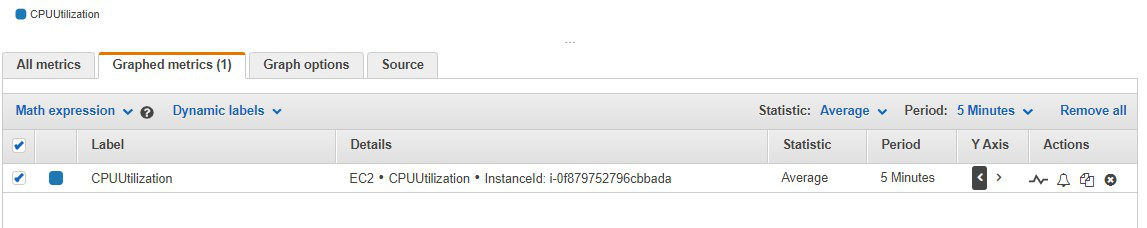
Step 13: Go to Graphed metrics, click on the bell icon
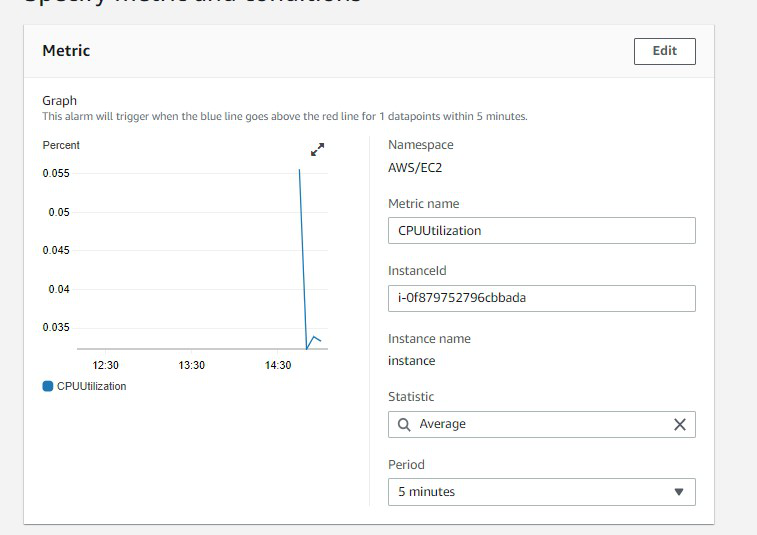
Step 14: This dashboard shows the components of Amazon Cloudwatch such as Namespace, Metric Name, Statistics, etc
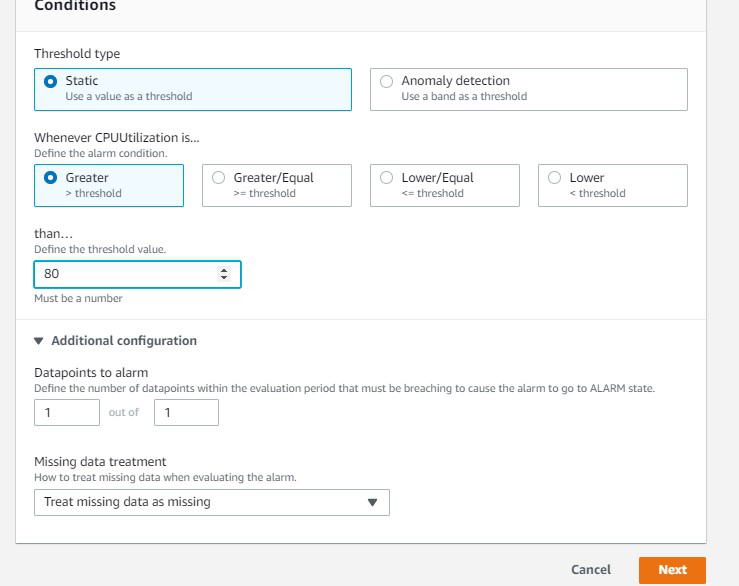
Step 15: Select the greater threshold. Also, specify the amount( i.e 80 ) of the threshold value. Click on Next.
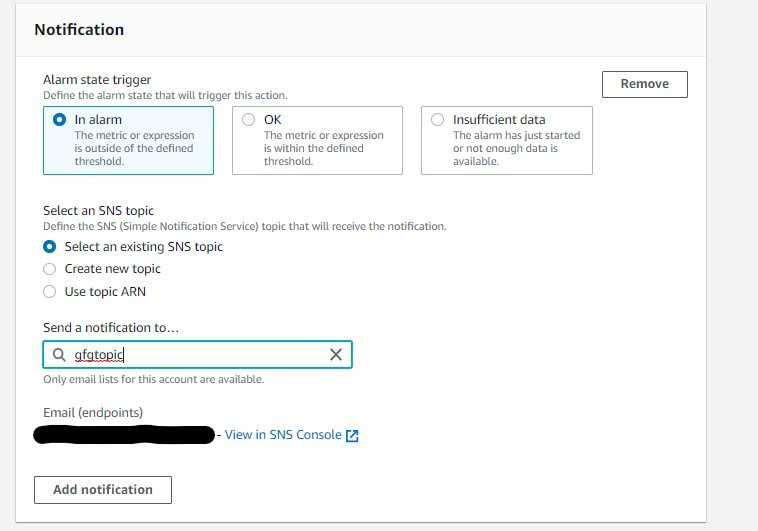
Step 16: Click on Select an existing SNS topic, also mention the name of the SNS topic you created now.
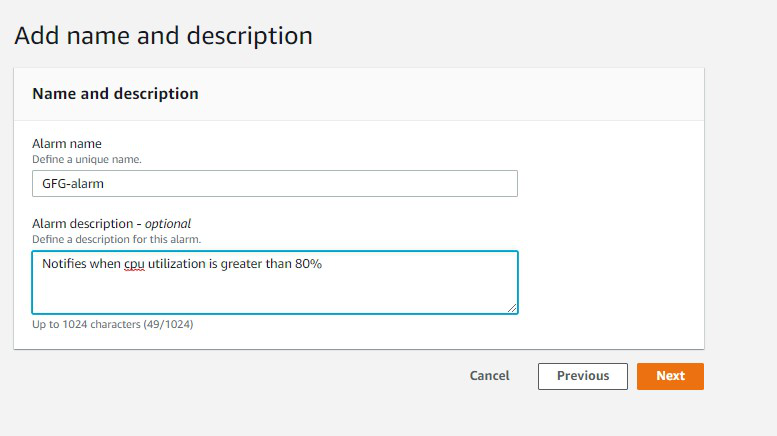
Step 17: Specify the name of alarm and description which is completely optional. Click on Next and then click on Create alarm.
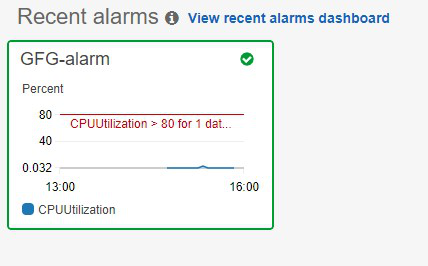
Step 18: The alarm is successfully created.
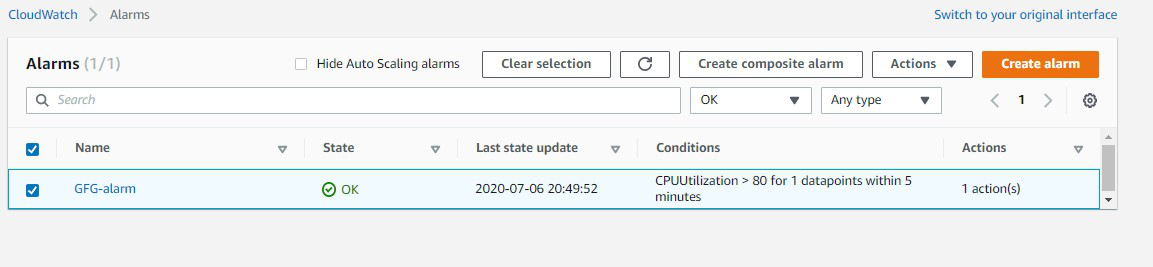
Step 19: You can see the graph which notifies whenever CPU utilization goes above 80%.
Use cases for CloudWatch
- CloudWatch can be used to monitor the performance of AWS resources, applications, and infrastructure components in real-time
- CloudWatch allows users to set up alarms that trigger notifications or automated actions in response to changes in the state of their resources.
- CloudWatch can be used to store, search, and analyze log data from various AWS services, applications, and infrastructure components.
- CloudWatch can be used to monitor the performance of EC2 instances, RDS databases, and other resources, which can then be used to trigger automatic scaling events.
Advantages of Amazon Cloudwatch
- A large amount of data is produced by web applications nowadays so amazon cloudwatch acts as a dashboard that contains the organized collection of whole data.
- It improves the total cost of ownership by providing alarms and also takes automated actions when there is an error in limits provided.
- Applications and resources can be optimized by examining the logs and metric data.
- Detailed Insights from the application are provided through data like CPU utilization, capacity utilization, memory utilization, etc
- It provides a great platform to compare and contrast the data produced by various AWS services.
Disadvantages of Amazon Cloudwatch
- Cloud Watch can be expensive, especially for large-scale monitoring and logging needs.
- Cloud Watch may not be able to handle large amounts of log data, especially during spikes in usage, making it difficult to maintain a consistent level of monitoring and logging.
- The monitoring and logging processes of CloudWatch can consume significant system resources, impacting the overall performance of an application.
- Integrating CloudWatch with other AWS services and third-party tools can be challenging.
- Setting up and managing CloudWatch can be complex, especially for users who are not familiar with cloud-based systems.