Azure NAT gateway monitoring integration
Azure NAT gateway is a network address translation (NAT) service that enables you to establish internet connectivity outside your virtual network without exposing the actual IP address of the virtual machine.
With Site24x7's integration, you can now monitor your NAT gateways to obtain accurate metrics, configure thresholds, and get instant alerts if there is a breach.
Setup and configuration
- Adding an Azure NAT gateway while configuring a new Azure monitor
If you haven't configured an Azure monitor yet, add one by following the steps below:
- Log in to your Site24x7 account.
- Choose Cloud from the left navigation pane, and select Azure > Add Azure Monitor. You can also follow these steps to add an Azure monitor.
- During Azure monitor configuration, in the Add Azure Monitor page, select Azure NAT gateway from the Service/Resource Types drop-down.
- Adding an Azure NAT gateway to an existing Azure monitor
If you already have an Azure monitor configured for the tenant, you can add the Azure NAT gateway using the following steps:
- Log in to your Site24x7 account.
- Go to Cloud > Azure and select your Azure monitor, then navigate to any of the dashboards from the left pane of your Azure monitor.
- Click the hamburger icon
 and then Edit, which will bring you to the Edit Azure Monitor page.
 - In the Edit Azure Monitor page, select the corresponding Subscription and Resource Group from the drop-down menu, select Azure NAT gateway from the Service/Resource Types drop-down, and click Save.
After successful configuration, go to Cloud > Azure, select Azure NAT gateway from the Azure Monitor drop-down. Now you can view the discovered NAT gateways.
Polling frequency
Site24x7's Azure NAT gateway monitor collects metric data every minute and the statuses from your NAT gateways every five minutes.
Supported metrics
| Metric name | Description | Statistic | Unit |
|---|---|---|---|
| Bytes | The total amount of bytes transmitted within the time period | Total | Bytes |
| Datapath Availability (Preview) | The NAT gateway datapath availability | Average | Count |
| Packets | The total number of packets transmitted within the time period | Total | Count |
| Dropped Packets | The total number of packets dropped | Total | Count |
| SNAT Connection Count | The total concurrent active connections | Total | Count |
| Total SNAT Connection Count | The total number of active SNAT connections | Total | Count |
Threshold configuration
- Global configuration
- Go to the Admin section in the left navigation pane.
- Select Configuration Profiles from the left pane and click Threshold and Availability (+) from the drop-down menu. Click Add Threshold Profile in the top right corner of the page.
- Select Azure NAT gateway as the monitor type. Now you can set the threshold values for all the metrics mentioned above.
- Monitor-level configuration
- Go to Cloud > Azure and select Azure NAT gateway from the drop-down menu.
- Choose a resource for which you would like to set a threshold and then click the hamburger
 icon on the top. Choose the Edit option, which will direct you to the Edit Azure NAT gateway monitor page.
 - You can set the threshold values for the metrics by selecting the Threshold and Availability option. You can also configure IT automation at the attribute level.
IT Automation
Site24x7 offers a set of exclusive IT Automation tools to auto-resolve performance degradation issues. These tools react to events proactively rather than waiting for manual intervention. IT Automation tools help automate repetitive tasks and automatically remediate threshold breaches. The alarms engine continually evaluates system events for which thresholds are set and executes the mapped automation when there is a breach.
How to configure IT automation for a monitor
Configuration Rules
Editing multiple monitors to associate different monitor groups or adding a different tag can be a tedious process. With Site24x7's Configuration Rules, you can automate the configuration settings of your monitoring resources. Also, Site24x7 allows you to create custom rules to track configuration changes continuously and achieve the ideal configuration settings.
How to add a configuration rule
Summary
The Summary tab will give you the performance data organized by time for the above-mentioned metrics.
- To view the summary, go to Cloud > Azure and click the Azure monitor, then select Azure NAT gateway.
- Click a resource and select the Summary tab.
By doing so, you can view metrics like Bytes, Packets, Dropped Packets, and many more.
Configuration Details
The Configuration Details tab provides details on configurations for application instances. In the Configuration Details tab, you'll find the NAT gateway ID in which you can view the Provisioning State, Resource Guide, and many more details.
- To get the configuration details, go to Cloud > Azure and click the Azure monitor, then select Azure NAT gateway.
- Click a resource and select the Configuration Details tab.
Reports
Gain in-depth data about the various parameters of your monitored resources and accentuate your service performance using our insightful reports.
To view reports for an Azure NAT gateway:
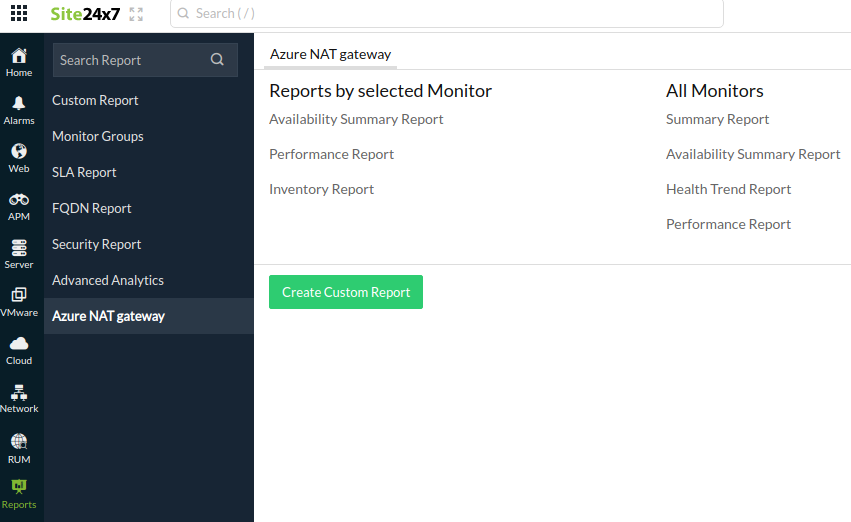
- Navigate to the Reports section on the left navigation pane.
- Select Azure NAT gateway from the menu on the left.
You can find the Availability Summary Report and the Performance Report for one selected monitor or you can get the Inventory Report, Summary Report, Availability Summary Report, Health Trend Report, and the Performance Report for all the NAT gateway monitors.

You can also get reports from the Summary tab of the Azure NAT gateway monitor.
- Go to the Summary tab of the Azure NAT gateway monitor, and get the Availability Summary Report of the monitor by clicking on Availability or Downtime.

No comments:
Post a Comment