Azure Storage Monitoring
Two capabilities are available in Azure for storage monitoring.
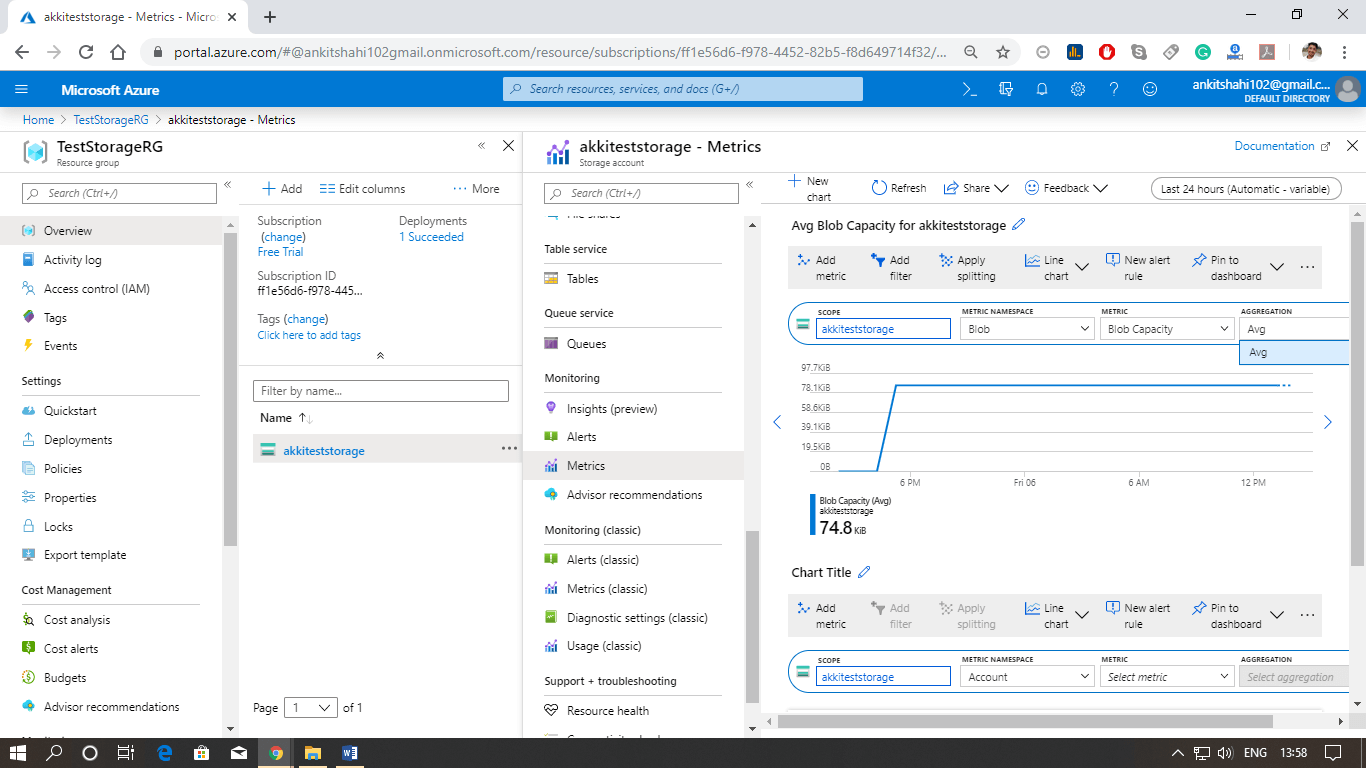
Continuous monitoring: Azure provides different metrics that are available both at the storage account level and individual service level also. These metrics are collected on an hourly basis, and we can define charts based on those metrics and pin those charts to the dashboard. We will see how to do that below.
Logging: We can enable client-side logging using Azure storage client library. And we can allow network logging, and server logging using Azure storage analytics. All these logging can be used to monitor an individual's transactions for continuous monitoring. These metrics are aggregated data, so we can't view an individual's transaction. But by enabling logging, we can investigate by going into the individual's transaction.
The essential tools that we use to monitor storage are audio storage analytics, which is explained below:
- Azure Storage Analytics performs logging and provides data quickly for the storage account. We can use this data to trace requests, analyze usages trends, and diagnose issues with our storage account.
- Metrics are enabled by default when we create a storage account. We can allow logging using the Azure portal, Rest APIs, or Client library. Metric uses the Get Blob Service properties, Get Queue Service Properties, Get Table Service Properties, and Get File Service Properties operations to enable Storage Analytics for all the services.
- The combined data is stored in a well-known blob (for logging) and in well-known tables (for metrics), which may use respective APIs service.
- Storage Analytics has a 20 TB limit on the amount of stored data that is independent of the total limit for your storage account.
Storage analytics logging:
Storage analytics records detailed information about successful and failed requests to a storage service. The data can be used to monitor individual requests and to diagnose issues with a storage service. Both authenticated and anonymous requests will be logged but at different levels. All logs are stored in block blobs inside a container named as $logs, which is automatically created when Storage Analytics is allowed for a storage account. The container ($logs) is located in the blob namespace of the storage account.
The logs are written in the following format
Storage analytics metrics
Storage Analytics stores metrics, which include combined transaction statistics and capacity data about the request to a storage service. There are two types of storage analytics metrics.
Transaction metrics
- Transaction aggregated data recorded at hourly or minute like reading, write, update, etc.
- Data is recorded at the service level and API operation level
Capacity metrics
- Capacity data is recorded daily for a storage account's Blob service, which includes Capacity container count, object count, etc.
All the metrics data for each of the storage service is stored in three tables reserved for that service.


No comments:
Post a Comment