AWS Certified Machine Learning – Specialty: Step-by-Step Hands-On
The AWS Certified Machine Learning – Specialty Certification exams mesh towards those who have an interest in fundamental skills of designing, implementing, deploying, and maintaining machine learning (ML) solutions for given business problems. This certification focuses on deep aspects of data manipulation and optimal machine learning solution development using AWS services and tools.
The walkthrough of the Step-By-Step Activity Guides of the AWS Certified Machine Learning – Specialty Certification Training program will prepare you thoroughly for this certification.
The hands-on list that we include in Our training AWS Certified Machine Learning – Specialty Certification
- Lab 1: Introduction to Python Basics
- Lab 2: Introducing the Pandas Library
- Lab 3: Mean, Mode & Median
- Lab 4: Percentiles and Moments
- Lab 5: Standard Deviation
- Lab 6: Using matplotlib & Seaborn
- Lab 7: Linear Regression
- Lab 8: Polynomial Regression & Multiple Regression
- Lab 9: K-Fold cross-validation to avoid overfitting
- Lab 10: Handling outliers
- Lab 11: AWS Free Tier Account Setup and Overview
- Lab 12: Creating AWS S3 Bucket and Uploading Data into S3
- Lab 13:Introduction to Amazon S3
- Lab 14: AWS Glue Data Catalog & Crawlers
- Lab 15: Running ETL Job Using Glue
- Lab 16: Kinesis Data Streams & Kinesis Data Firehose
- Lab: 17: Running Data Analytics using Kinesis
- Lab 18: Amazon Athena With Glue Integration
- Lab 19: Overview of Amazon Quicksight
- Lab 20: Hadoop Overview & Elastic MapReduce (EMR)
- Lab 21: Apache Spark on EMR
- Lab 22: EMR Notebooks, Security, and Instance Types
- Lab 23: Amazon Lex
- Lab 24: Amazon Polly
- Lab 25: Amazon Rekognition
- Lab 26: Amazon Translate
- Lab 27: Image Classification Algorithm
- Lab 28: Learner algorithm
- Lab 29: Random Cut Forest (RCF) Algorithm
- Lab 30: Monitoring with CloudWatch
- Lab 31: Logging with CloudWatch
- Lab 32: Logging in SageMaker API Calls with AWS CloudTrail
Lab 1: Introduction to Python Basics

It is a Programming Language used for:
- web development (server-side),
- software development,
- mathematics,
- system scripting.
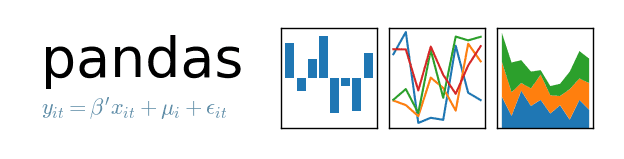
Lab 2: Introducing the Pandas Library
Pandas is the most popular Python library that is used for data analysis. It provides highly optimized performance with back-end source code that is purely written in C or Python.
In this lab, you will learn about Pandas used for Data Analysis.
Lab 3: Mean, Mode & Median
- The mean is the average of a data set. For example , the mean in this set of number is 26
22,23,24,25,26,27,28,29,30 (we have to add all numbers then divide it by total numbers in this 234/9=26) - The mode is the most common number in a data set.For example, the mode in this set of numbers is 21:
21, 21, 21, 23, 24, 26, 26, 28, 29, 30, 31, 33 - The median is the middle of the set of numbers.To find the median, list your data points in ascending order and then find the middle number. The middle number in this set is 28 as there are 4 numbers below it and 4 numbers above:
23, 24, 26, 26, 28, 29, 30, 31, 33

Lab 4: Percentiles and Moments
When a value is given x percentile, this means that x percentage of values in the distribution is below that value.
Moments try to measure the shape of the probability distribution function. The zeroth moment is the total probability of the distribution which is 1. The first moment is the mean. The second moment is the variance. The third moment is the skew which measures how lopsided the distribution is. The fourth moment is kurtosis which is the measure of how sharp is the peak of the graph.
Moments are important because, under some assumptions, moments are a good estimate of how the population probability distribution is based on the sample distribution.
Lab 5: Standard Deviation
Standard deviation is an excellent way to identify outliers. Data points that lie more than one standard deviation from the mean can be considered unusual. In many cases, data points that are more than two standard deviations away from the mean are not considered in analysis.
Standard deviation is denoted as σ and standard deviation is the square root of the variance
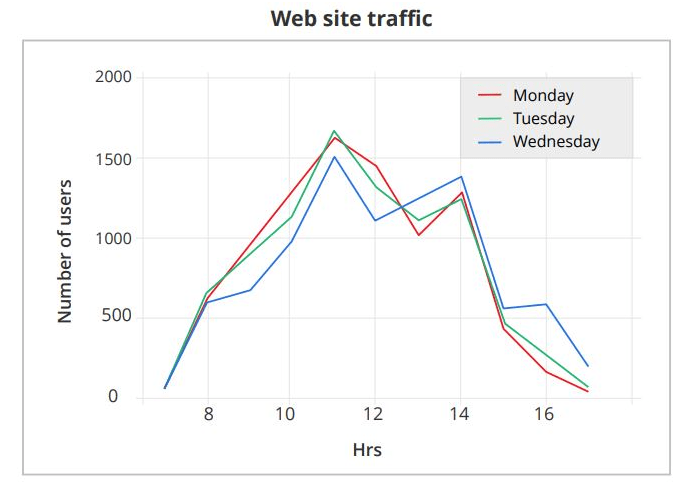
Lab 6: Using Matplotlib & Seaborn
Matplotlib is a plotting library for the Python programming language and its numerical mathematics extension NumPy. It provides an object-oriented API for embedding plots into applications using general-purpose GUI toolkits like Tkinter, wxPython, Qt, or GTK+.
In this Lab, you will learn how to Visualize Data using MatPlot Lib.
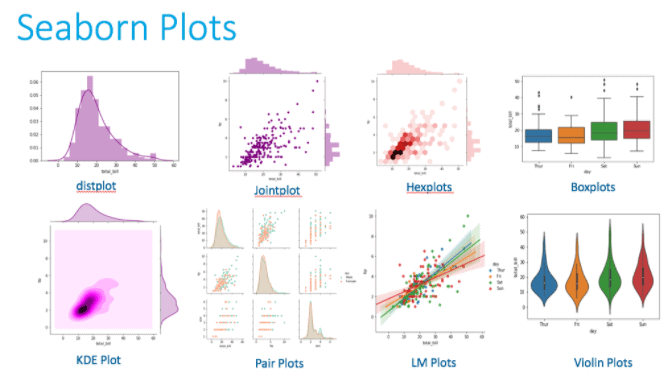
Data visualization provides insight into the distribution and relationships between variables in a dataset. Seaborn is a data visualization library for Python that runs on top of the popular Matplotlib data visualization library, although it provides a simple interface and aesthetically better-looking plots.
In this Lab, you will learn to Visualize Data using Seaborn.
Lab 7: Linear Regression
Linear regression attempts to model the relationship between two variables by fitting a linear equation to observed data. One variable is considered to be an explanatory variable, and the other is considered to be a dependent variable. For example, a modeler might want to relate the weights of individuals to their heights using a linear regression model
Lab 8: Polynomial Regression & Multiple Regression
Polynomial regression is a special case of linear regression where we fit a polynomial equation on the data with a curvilinear relationship between the target variable and the independent variables.
In a curvilinear relationship, the value of the target variable changes in a non-uniform manner with respect to the predictor (s).
This linear equation can be used to represent a linear relationship. But, in polynomial regression, we have a polynomial equation of degree n represented as:
![]()
Here:
𝜃0 is the bias,
𝜃1, 𝜃2, …, 𝜃n are the weights in the equation of the polynomial regression,
and n is the degree of the polynomial
Multiple Linear Regression attempts to model the relationship between two or more features and a response by fitting a linear equation to observed data.
- The steps to perform multiple linear Regression are almost similar to that of simple linear Regression.
- The Difference Lies in the evaluation
- We can use it to find out which factor has the highest impact on the predicted output and now different variable relate to each other.
Here : Y = b0 + b1 * x1 + b2 * x2 + b3 * x3 + …… bn * xn
Y = Dependent variable and x1, x2, x3, …… xn = multiple independent variables
Lab 9: K-Fold cross-validation to avoid overfitting
Cross-validation is a powerful preventative measure against overfitting.
The idea is clever: Use your initial training data to generate multiple mini train-test splits. Use these splits to tune your model.
In standard k-fold cross-validation, we partition the data into k subsets, called folds. Then, we iteratively train the algorithm on k-1 folds while using the remaining fold as the test set (called the “holdout fold”).
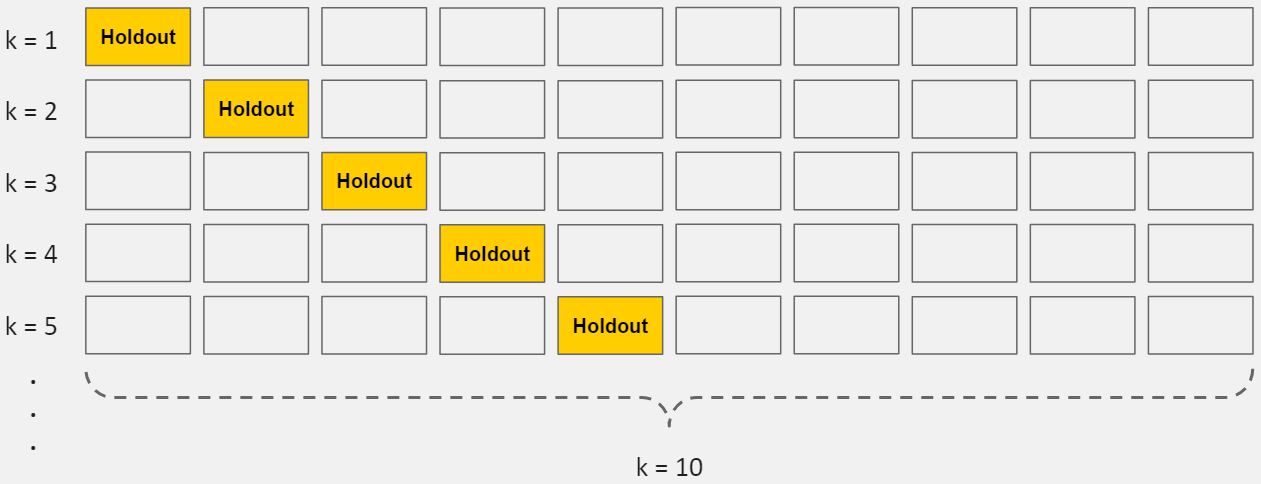
Cross-validation allows you to tune hyperparameters with only your original training set. This allows you to keep your test set as a truly unseen dataset for selecting your final model.
Lab 10: Handling outliers
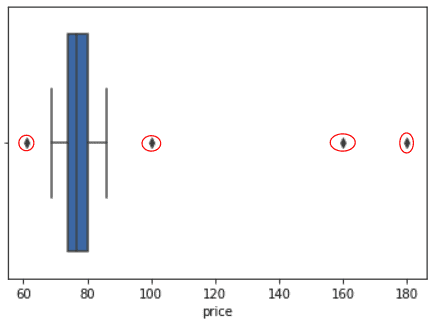
An outlier is an extremely high or low value in the dataset. Outliers can mislead and skew the training process of machine learning resulting in, less accurate and longer training times and poorer results.
In this lab, we will use Z-Score and then remove outliers and cleaning our data.
Lab 11: AWS Free Tier Account Setup And Overview
Before starting with the labs we’ll need a free tier Account for Amazon Web Services AWS to get started where we will use a wide variety of tools and services for machine learning solution development, including:
- SageMaker
- Storage
- Data Processing
- Machine learning services
To learn, how to set up a free tier AWS account, check our Step by steps blog How To Create AWS Free Tier Account
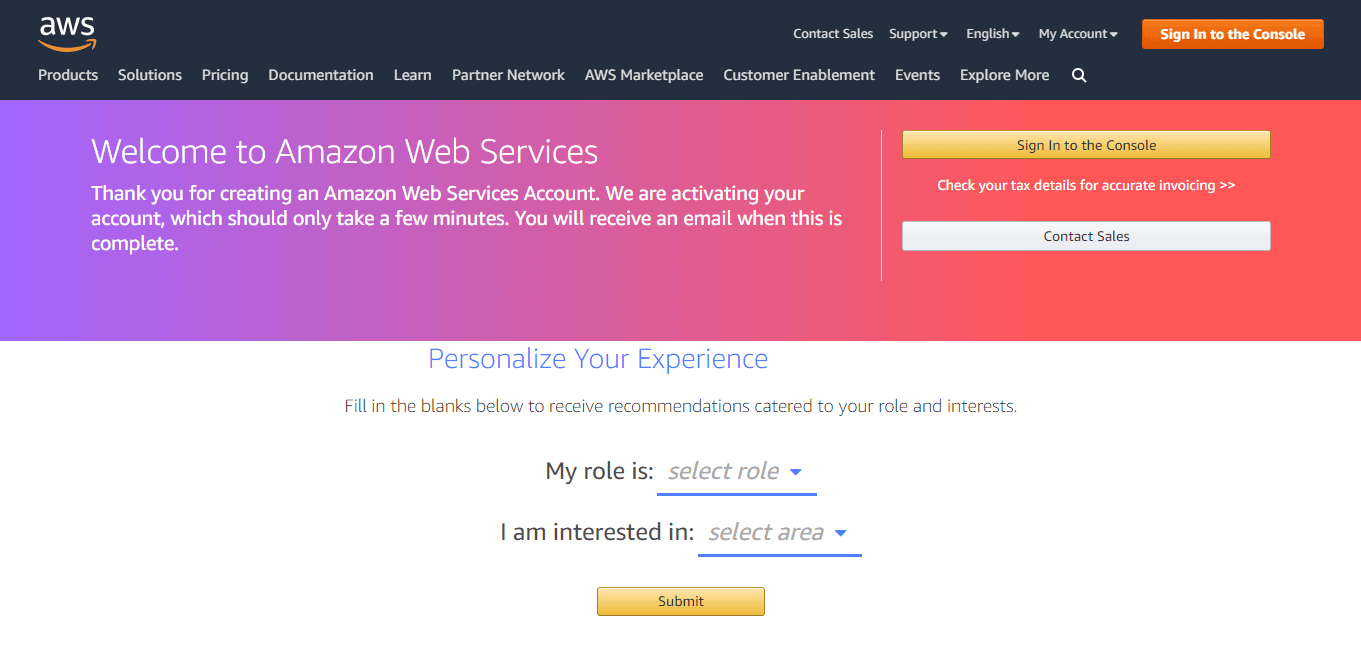
After you are done with the registration for the AWS Free tier account, you will get a page as shown below informing you that your account is being activated.
Lab 12: Creating AWS S3 Bucket and Uploading Data into S3
Amazon S3 contains a simple web services interface that you can simply use to store and retrieve any amount of data, at any time, from anywhere on the web. Buckets are the fundamental containers for data storage in Amazon S3.
In this Lab, you will learn how to create a bucket S3 using the management console.

Also Read: Features of AWS Organizations
Lab 13: Introduction to Amazon S3
Lifecycle Transition: To manage your objects so that they are stored cost-effectively throughout their lifecycle, configure their Amazon S3 Lifecycle. An S3 Lifecycle structure is a set of rules that define actions that Amazon S3 covers to a group of objects.
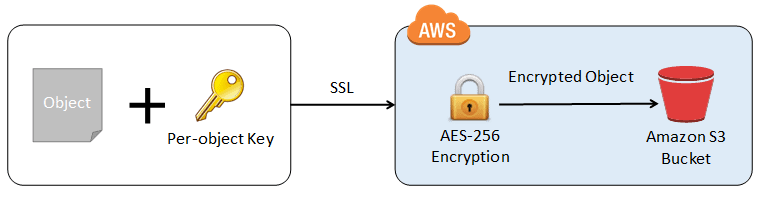
In this Lab, you will learn how to Set a lifecycle configuration on a bucket.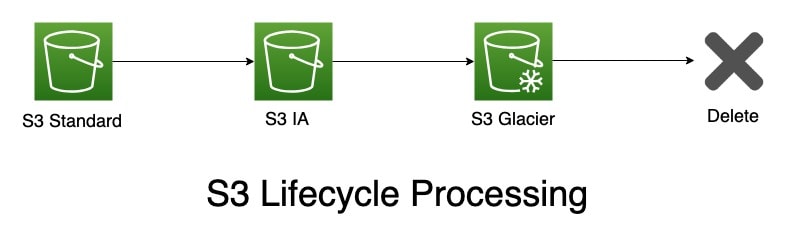 S3 Encryption of S3 Object and Other Security: Amazon S3 encrypts your data at the object level as it writes it to disks in its data centers and decrypts it for you when you access it. As long as you authenticate your request and you have access permissions, there is no difference in the way you access encrypted or unencrypted objects.
In this lab, you will learn how to Encrypts your data in S3 bucket.
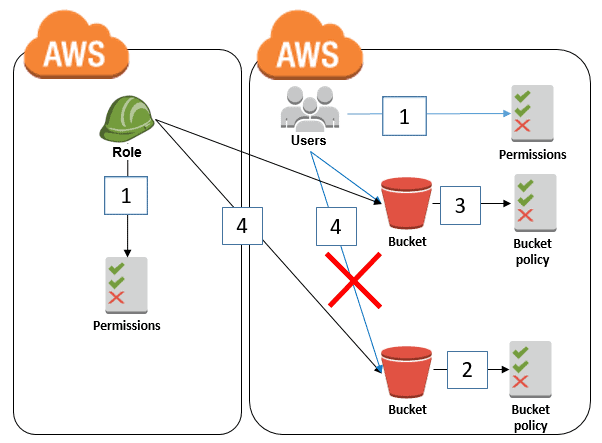
 Bucket Policy and Its IAM Role for S3 Bucket Access: The bucket policy allows access to the role from the other account. The IAM user and role can access the bucket without the Deny in the bucket policy. The role can access both buckets because the Deny is only for principals whose user: id does not equal that of the role.
In this Lab, you will learn how to Create a Bucket Policy and Its IAM Role for S3 Bucket.
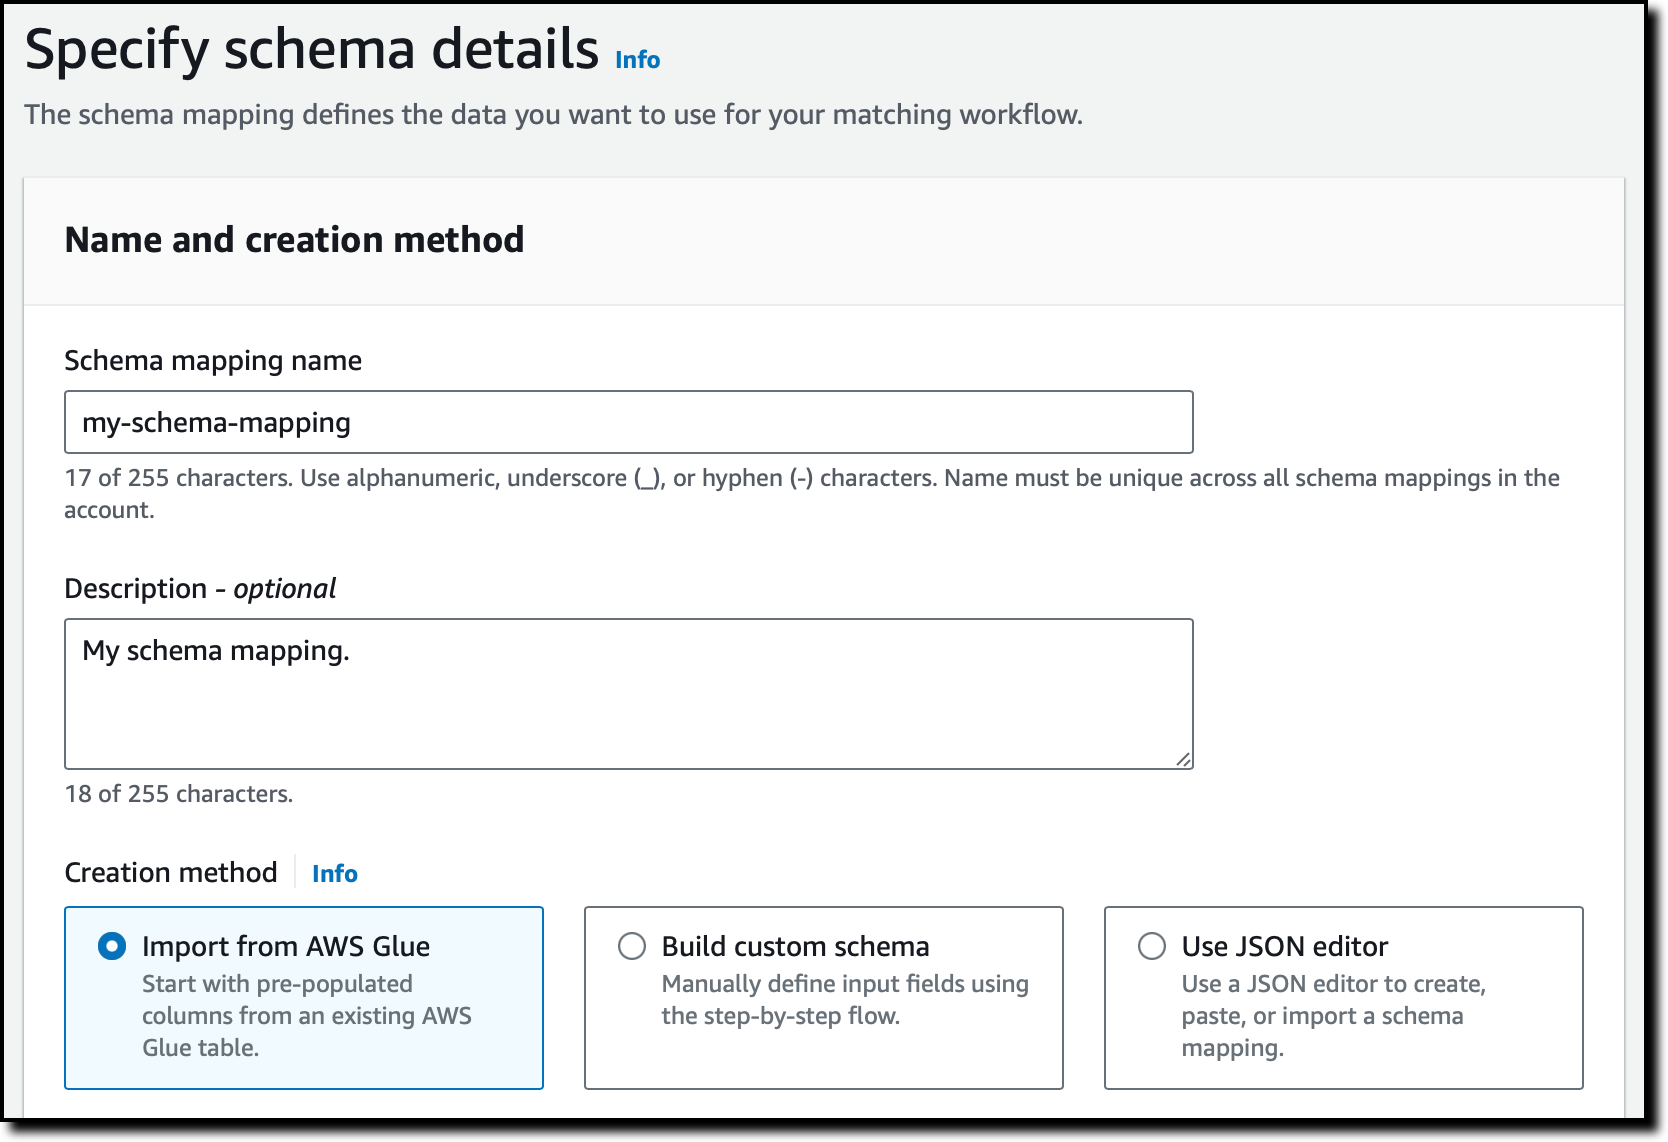
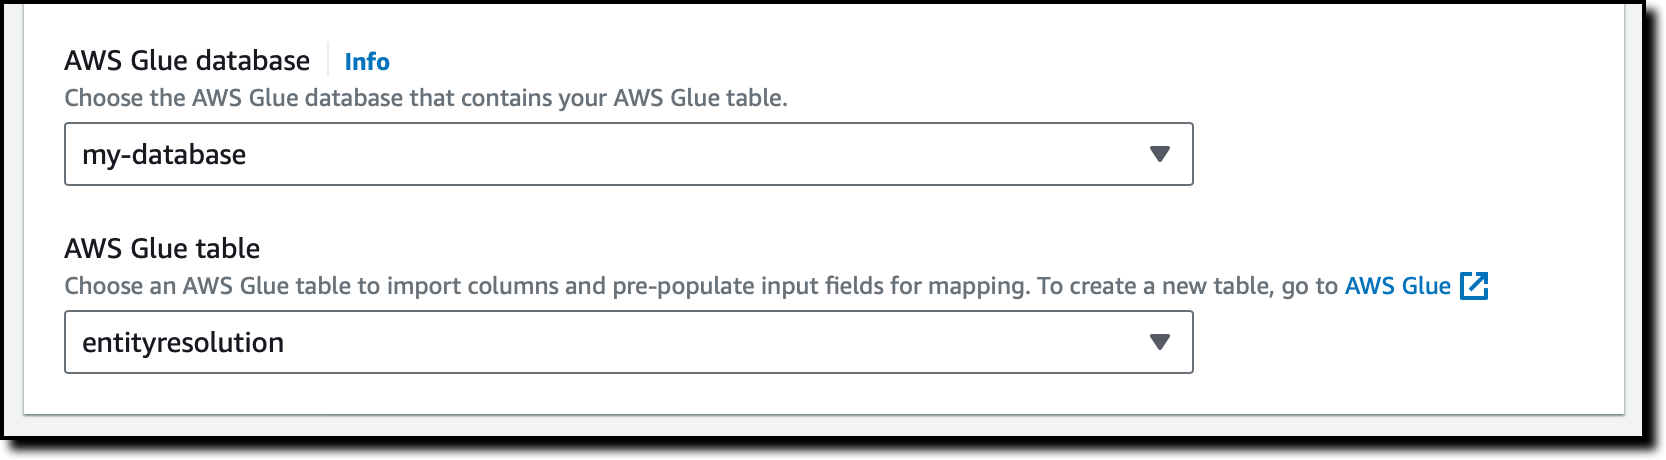
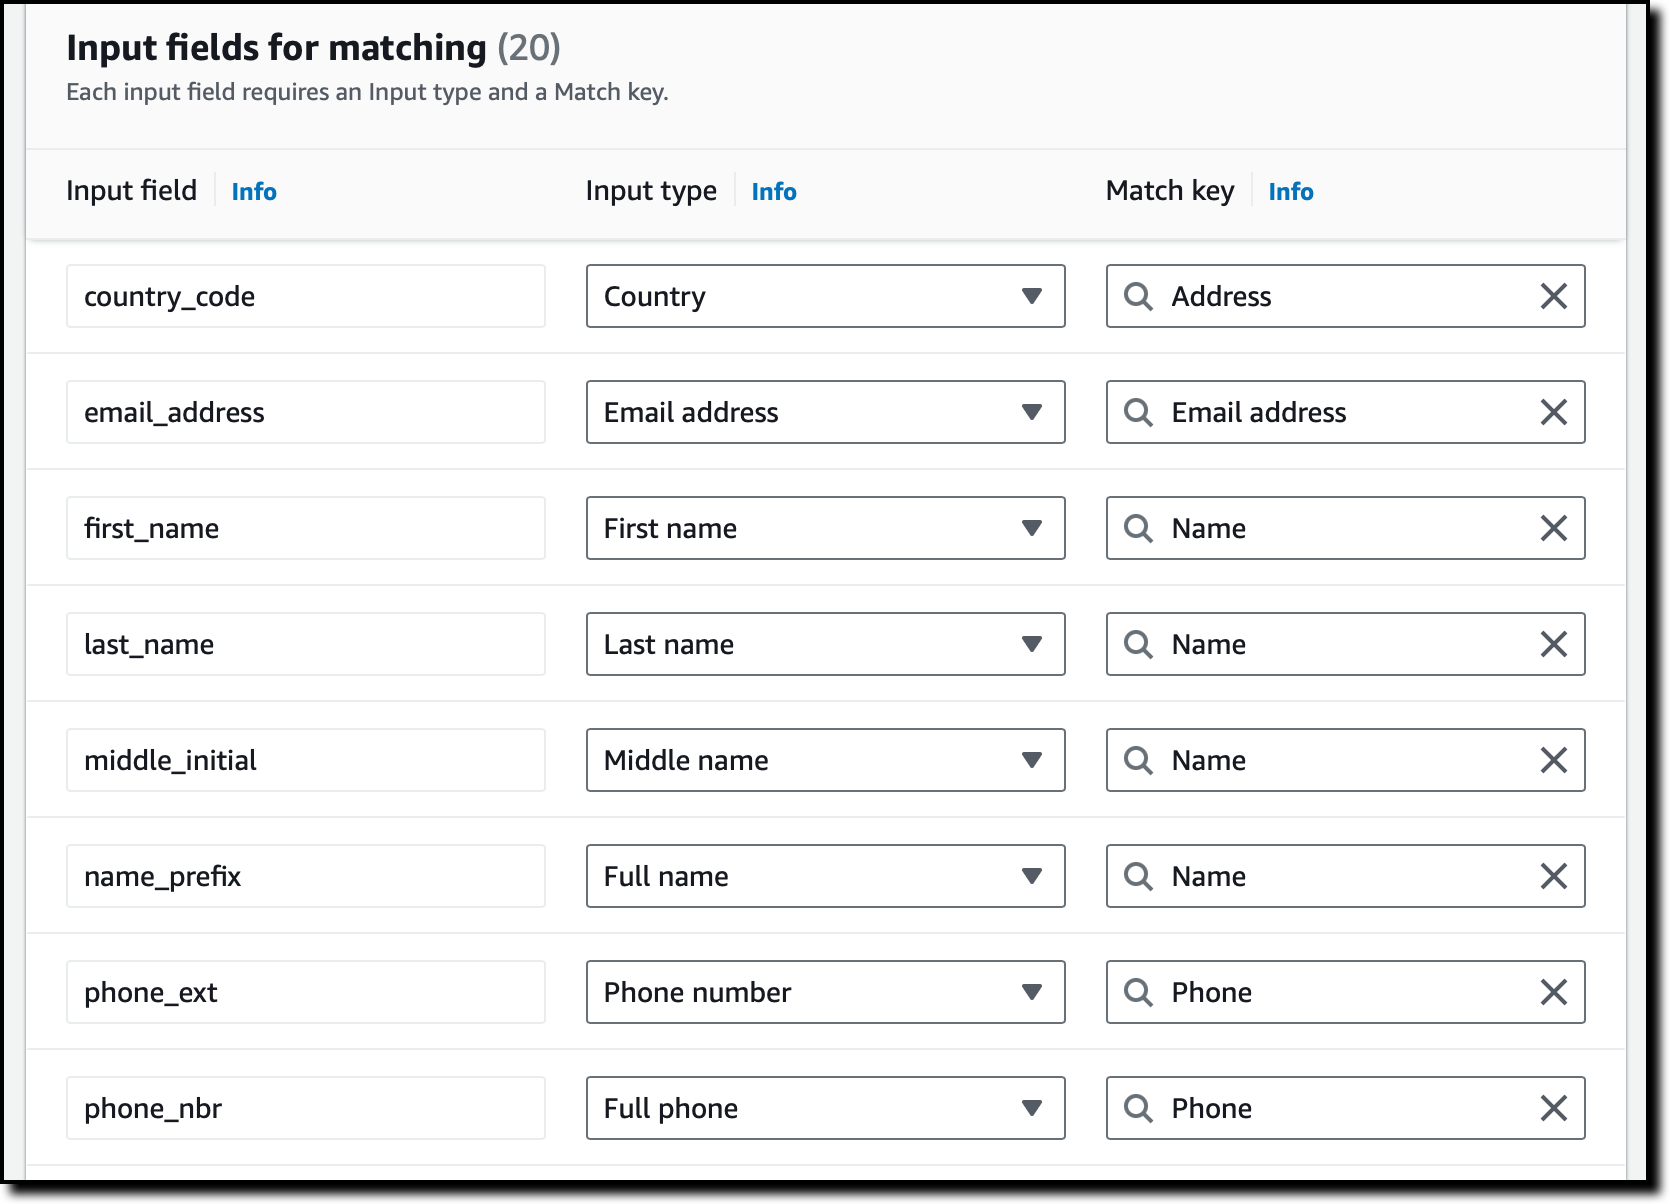
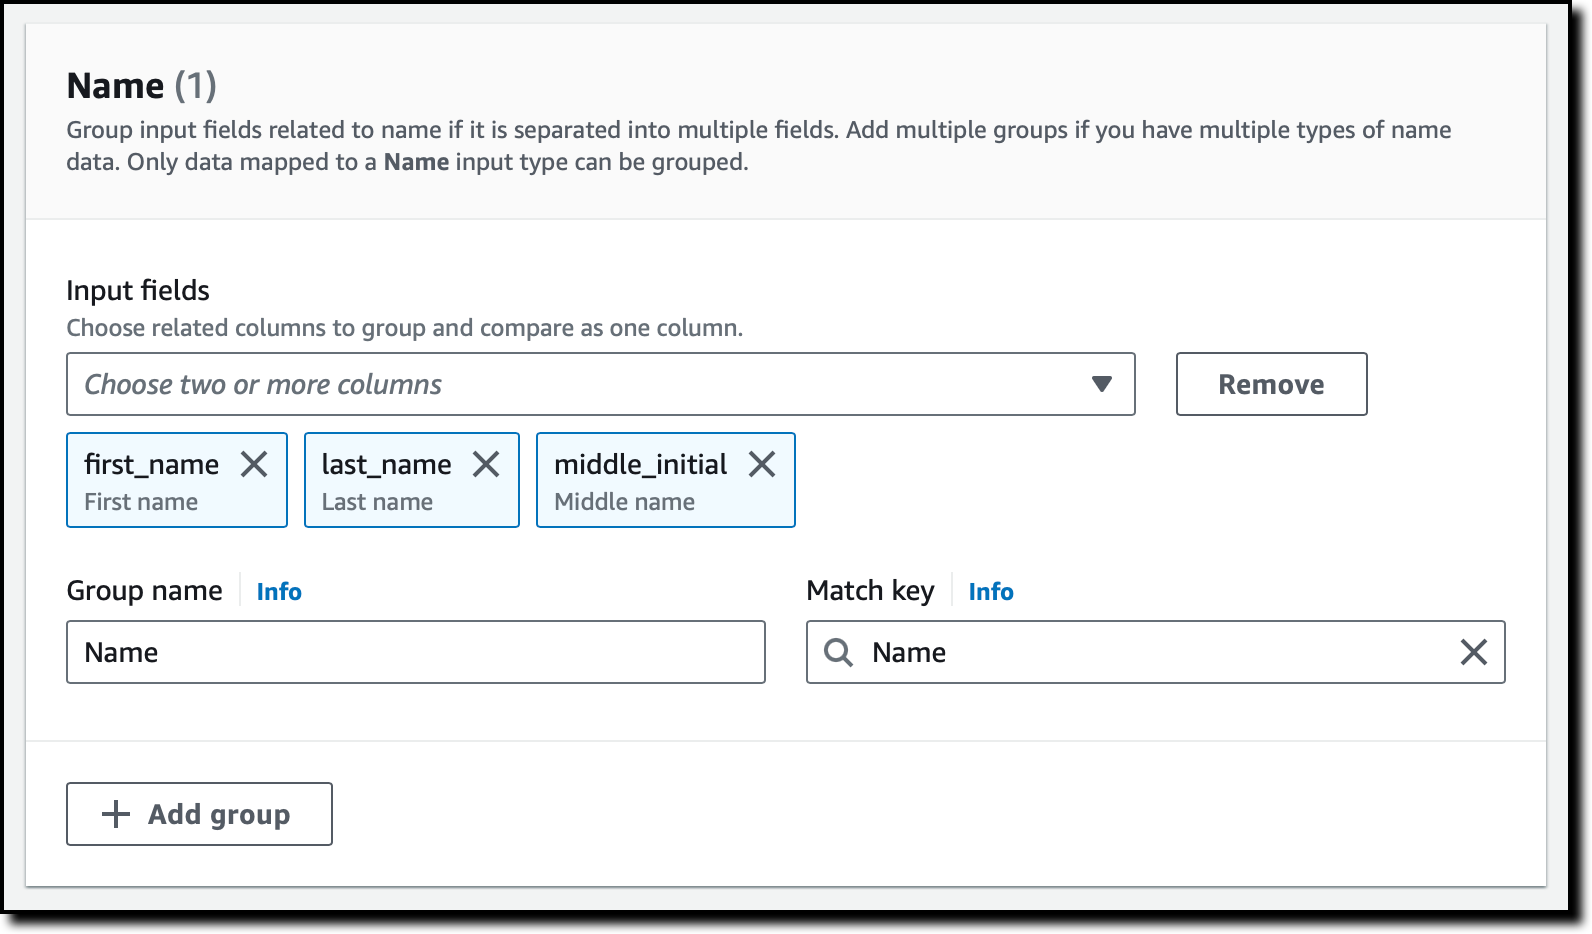
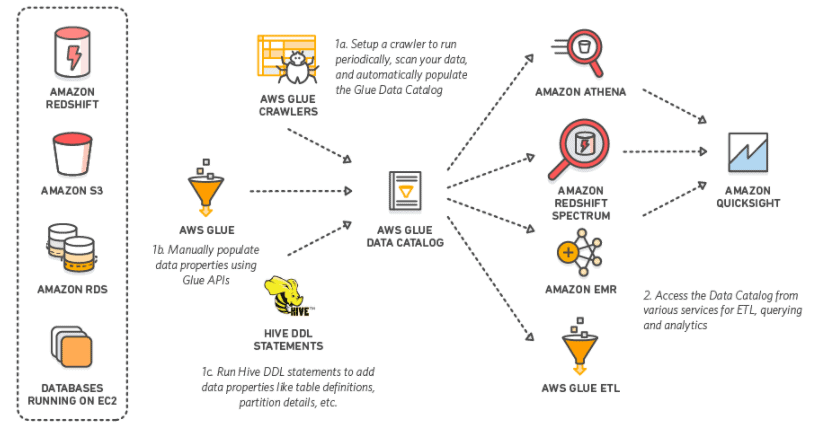
Lab 14: AWS GLUE Data Catalog And Crawlers
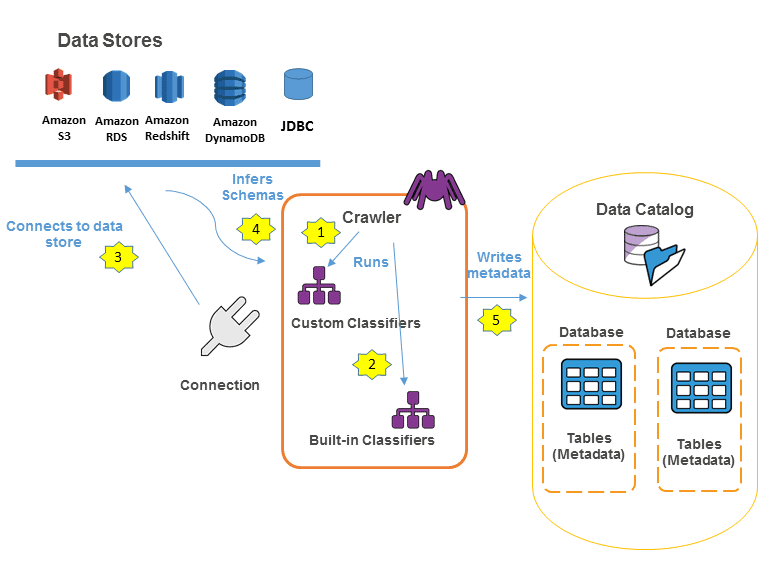
The AWS Glue Data Catalog is a completely managed service that allows you to store, annotate, and share metadata within the AWS Cloud, in the same manner, you would in an Apache Hive meta store. Each AWS account has 1 AWS Glue Data Catalog per AWS region. It comes with a uniform repository where disparate systems can store and find metadata to stay records of data in data silos and use that metadata to query and transform your data.
In this Lab, you’ll learn how a crawler populates the AWS Glue Data Catalog.
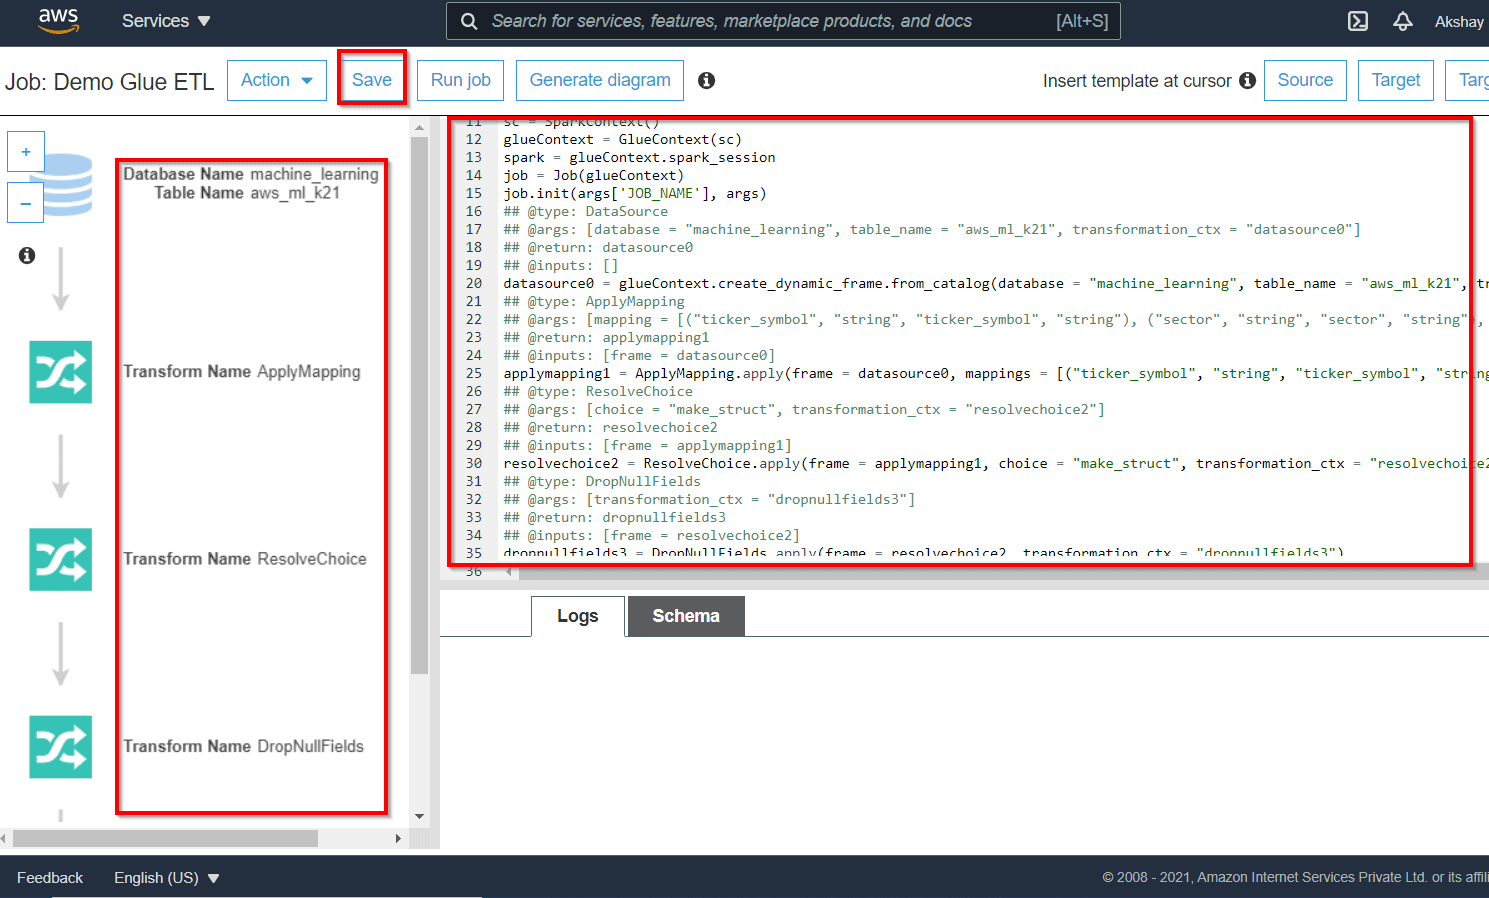
Lab 15: Running ETL Job using Glue
AWS Glue service provides console as well as API operations to set up and maintain your ETL workload. You’ll be able to use API operations through different language-specific SDKs and from the AWS CLI.
Using the metadata within the Data Catalog, AWS Glue can self-generate Scala or PySpark scripts with AWS Glue extensions that you can use and customize to perform various ETL operations. For example, you’ll extract, clean, and transform raw data, and then store the result in various repositories, where it can be queried and analyzed.
A job is the business logic that executes the extract, transform, and load (ETL) work in AWS Glue. Once you start a job, AWS Glue runs a script that will extract data from sources, transforms the data, and loads it into targets. You’ll be able to create jobs in the ETL segment of the AWS Glue console.
In this Lab, you will learn how to Create a Glue ETL job.
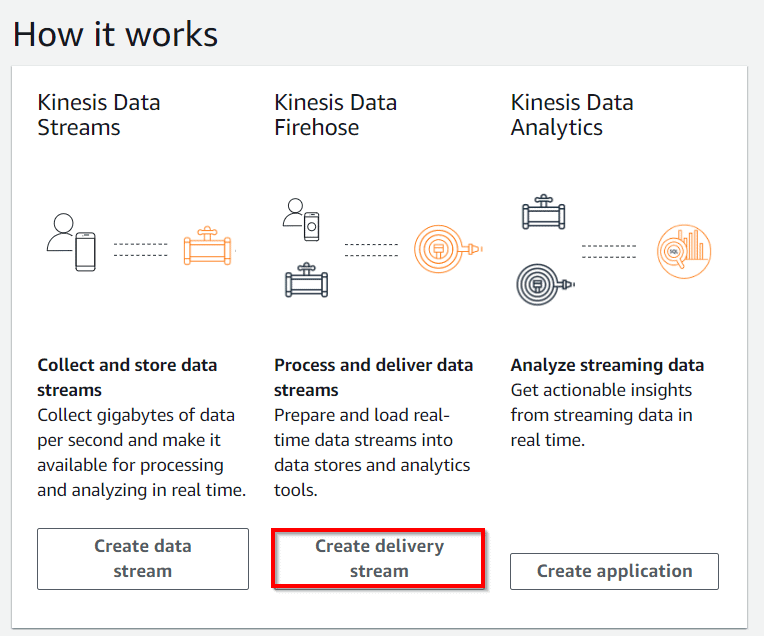
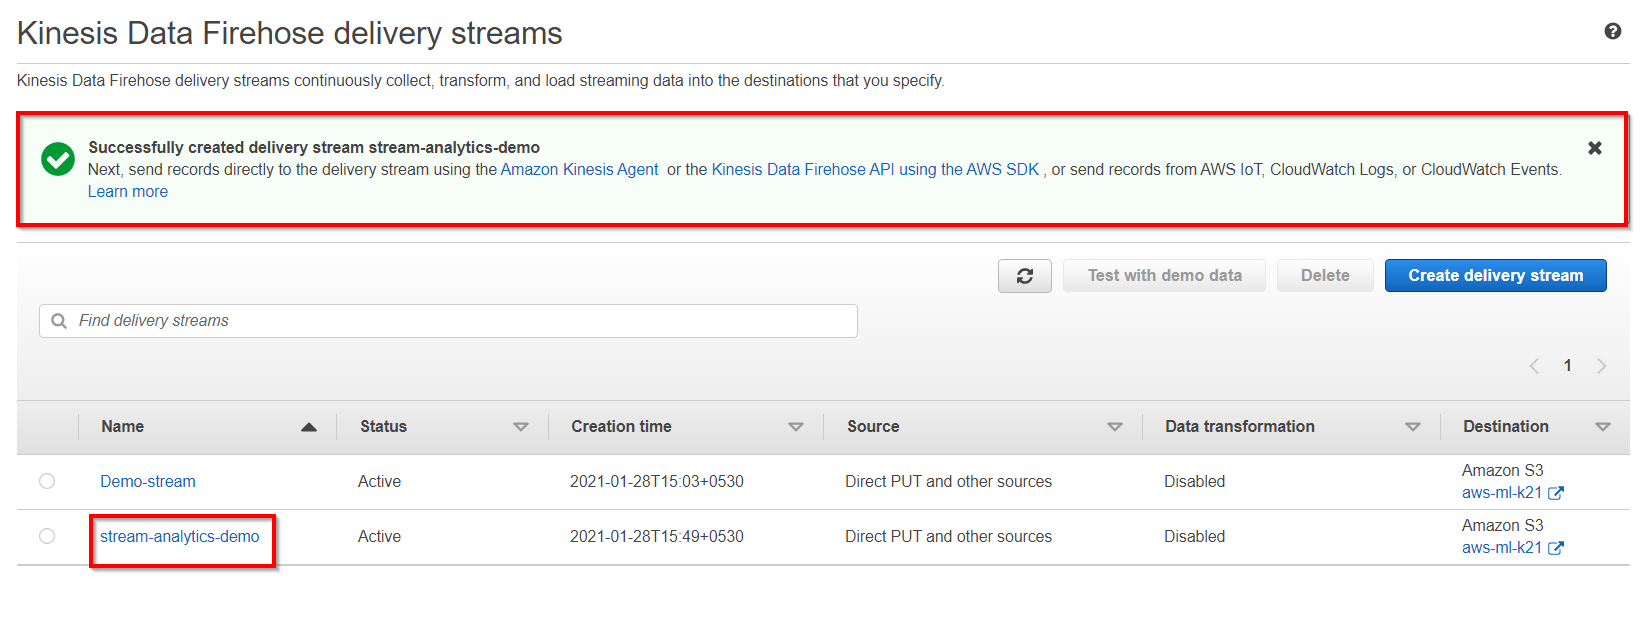
Lab 16: Kinesis Data Stream and Kinesis Data Firehose
Amazon Kinesis Data Firehose is the very simplest way to load near real-time streaming data into data stores and analytics tools. It is able to capture, transform, and load streaming data into Amazon Redshift, Amazon S3, Amazon Elasticsearch Service, and Splunk, enabling near real-time analytics with present business intelligence tools and dashboards you’re already using nowadays.
It is a completely managed service that automatically scales to match the throughput of your incoming data and requires no ongoing administration. It can also batch, compress, and encrypt your data before loading it, minimizing the size of storage used at the target and enhance security.
In this Lab, you will learn how to prepare and load real-time data streams into data stores and analytics tools.
Also Check: Features And Benefits of Amazon Kinesis
Lab 17: Running Data Analytics using Kinesis
Amazon Kinesis Data Analytics is the very simplest way to study real-time streaming data, gain actionable insights, and answer to your business and customer demand in real-time.
Amazon Kinesis Data Analytics reduces the complexity of managing, building, and integrating streaming applications with other AWS services. You’ll immediately build SQL queries and complicated Apache Flink applications in a supported language like Scala or Java using built-in templates and operators for frequent processing functions to arrange, aggregate, transform and analyze data at any scale.
In this Lab, you will learn how to Create an Application, Configure Input, and Add Real-Time Analytics.
Lab 18: Athena with Glue Integration
Athena is an interactive query service that creates it very easy to analyze data in Amazon S3 using standard SQL. It is serverless, so there is no need to manage infrastructure, and you pay only for the queries that you are running. It is easy to use.
Simply point to your data in S3, specify the schema, and start querying using standard SQL. Most results are delivered within seconds. With Athena, there’s no need for high-level ETL jobs to prepare your data for analysis.
In this Lab, you will learn how to quickly analyze large-scale datasets.
Lab 19: Overview of Amazon Quicksight
Amazon QuickSight is a scalable, serverless, embeddable, machine learning-powered business intelligence (BI) service built for the cloud. QuickSight lets you easily create and publish interactive BI dashboards that include Machine Learning-powered insights. QuickSight dashboards can be accessed from any device, and seamlessly embedded into your applications, portals, and websites

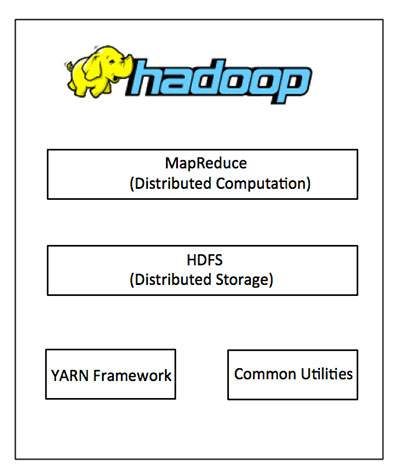
Lab 20: Hadoop Overview & Elastic MapReduce (EMR)
Hadoop is an Apache open-source framework written in java that allows distributed processing of large datasets across clusters of computers using simple programming models. Hadoop is designed to scale up from a single server to thousands of machines, each offering local computation and storage.
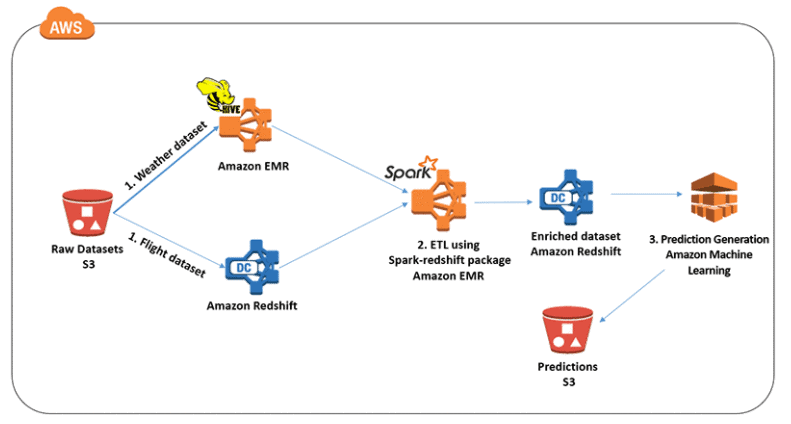
Amazon Elastic MapReduce (EMR) is a web service that provides a managed framework to run data processing frameworks such as Apache Hadoop, Apache Spark, and Presto in an easy, cost-effective, and secure manner.
It is used for data analysis, web indexing, data warehousing, financial analysis, scientific simulation, etc
Lab 21: Apache Spark on EMR
Apache Spark is a distributed processing framework and programming model that helps you do machine learning, stream processing, or graph analytics using Amazon EMR clusters. Similar to Apache Hadoop, Spark is an open-source, distributed processing system commonly used for big data workloads.
In this lab, you will learn how to Run Spark Jobs on EMR Cluster.
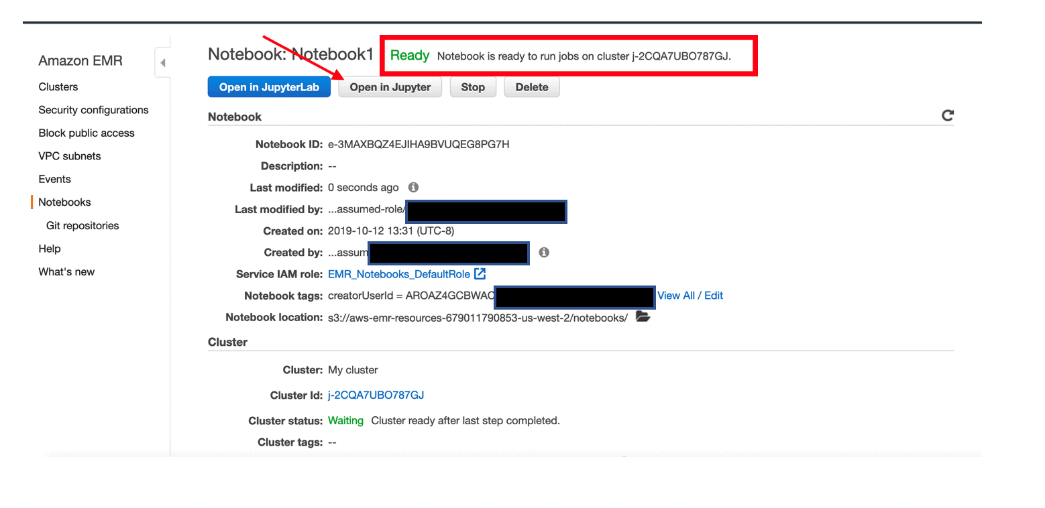
Lab 22: EMR Notebooks, Security, and Instance Types
EMR Notebooks are simple Jupyter notebooks that can connect to EMR clusters and run Spark jobs on the cluster. The notebook code is persisted durably to S3. By using EMR Notebooks you separate the execution (EMR) and code development (Notebook) environments. Using EMR Notebooks allows you to share the EMR cluster between users and move the development environment to other clusters as needed.
In this lab, you will learn how to Create notebooks, Security, and Instance Types.
Lab 23: Amazon Lex
Amazon Lex is a service for building conversational interfaces into any application using voice and text. Amazon Lex provides the advanced deep learning functionalities of automatic speech recognition (ASR) for converting speech to text, and natural language understanding (NLU) to recognize the intent of the text, to enable you to build applications with highly engaging user experiences and lifelike conversational interactions.
Lab 24: Amazon Polly
Amazon Polly is a service that turns text into lifelike speech, allowing you to create applications that talk, and build entirely new categories of speech-enabled products. Polly’s Text-to-Speech (TTS) service uses advanced deep learning technologies to synthesize natural-sounding human speech. With dozens of lifelike voices across a broad set of languages, you can build speech-enabled applications that work in many different countries.
Lab 25: Amazon Rekognition
- Amazon Rekognition is a service that makes it easy to add image and video analysis to our application using deep learning technology that requires no mastering in machine learning.
- With Amazon Rekognition, we can easily identify text, objects, scenes, and activities in images and videos.
- It provides facial analysis and facial search capabilities with high accuracy. We can easily detect and compare faces user verification, people counting, and human safety use cases.
- It can identify the objects and scenes in images that are exact to your business needs.

Lab 26: Amazon Translate
Amazon Translate is a neural machine translation service that delivers fast, high-quality, affordable, and customizable language translation. Neural machine translation is a form of language translation automation that uses deep learning models to deliver more accurate and more natural-sounding translation than traditional statistical and rule-based translation algorithms.
Lab 27: Image Classification Algorithm
The Amazon SageMaker image classification algorithm is a supervised learning algorithm that supports multi-label classification. It takes an image as input and outputs one or more labels assigned to that image. It uses a convolutional neural network (ResNet) that can be trained from scratch or trained using transfer learning when a large number of training images are not available.
Lab 28: Learner algorithm
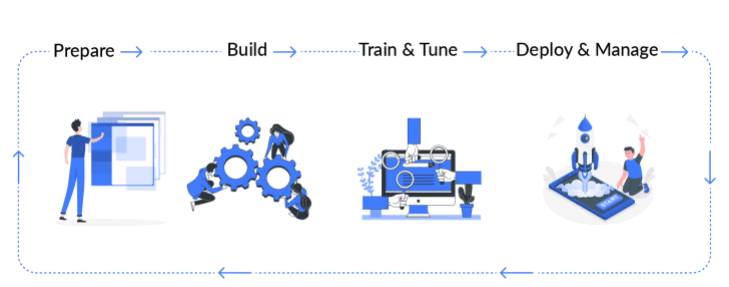
Amazon SageMaker is a fully-managed service that enables data scientists and developers to quickly and easily build, train, and deploy machine learning models at any scale. Amazon SageMaker includes modules that can be used together or independently to build, train, and deploy your machine learning models.
In this lab, you will learn about Linear Learner in SageMaker.
Lab 29: Random Cut Forest (RCF) Algorithm
Amazon SageMaker Random Cut Forest (RCF) is an unsupervised algorithm for detecting anomalous data points within a data set. These are observations which diverge from otherwise well-structured or patterned data. Anomalies can manifest as unexpected spikes in time series data, breaks in periodicity, or unclassifiable data points. They are easy to describe in that, when viewed in a plot, they are often easily distinguishable from the “regular” data. Including these anomalies in a data set can drastically increase the complexity of a machine learning task since the “regular” data can often be described with a simple model.
Lab 30: Monitoring with CloudWatch
Amazon CloudWatch is a monitoring service for Amazon Web Services cloud resources and the applications you run on Amazon Web Services. You can use Amazon CloudWatch to collect and track metrics, collect and monitor log files, set alarms, and automatically react to changes in your Amazon Web Services resources. Amazon CloudWatch can monitor Amazon Web Services resources such as Amazon EC2 instances, Amazon DynamoDB tables, and Amazon RDS DB instances, as well as custom metrics generated by your applications and services, and any log files your applications generate. You can use Amazon CloudWatch to gain system-wide visibility into resource utilization, application performance, and operational health. You can use these insights to react and keep your application running smoothly.
Lab 31: Logging with CloudWatch
CloudWatch Logs enables you to centralize the logs from all of your systems, applications, and AWS services that you use, in a single, highly scalable service. You can then easily view them, search them for specific error codes or patterns, filter them based on specific fields, or archive them securely for future analysis. CloudWatch Logs enables you to see all of your logs, regardless of their source, as a single and consistent flow of events ordered by time, and you can query them and sort them based on other dimensions, group them by specific fields, create custom computations with a powerful query language, and visualize log data in dashboards.
Lab 32: Logging in SageMaker API Calls with AWS CloudTrail
Amazon SageMaker is integrated with AWS CloudTrail, a service that provides a record of actions taken by a user, role, or an AWS service in SageMaker. CloudTrail captures all API calls for SageMaker, with the exception of InvokeEndpoint, as events. The calls captured include calls from the SageMaker console and code calls to the SageMaker API operations. If you create a trail, you can enable continuous delivery of CloudTrail events to an Amazon S3 bucket, including events for SageMaker. If you don’t configure a trail, you can still view the most recent events in the CloudTrail console in Event history. Using the information collected by CloudTrail, you can determine the request that was made to SageMaker, the IP address from which the request was made, who made the request, when it was made, and additional details.