Monday, 5 August 2024

aws lab step by step process


Prerequisites

  1. Have an AWS account.
  2. Create an IAM user with administrator permissions. To do this, you can just follow this tutorial. I recommend you give granular permissions to the user that will do the provisioning.
  3. Install and configure AWS CLI.

If something from the above doesn’t work, it might be because a permission is missing, or the CLI is not configured properly. I’ll let you know exactly what’s needed in the following steps.

Go to AWS Batch

Log in to your AWS account and look for AWS Batch in the initial screen, or you can go directly by using this link.

You’ll see a screen like the following:
AWS Batch guide

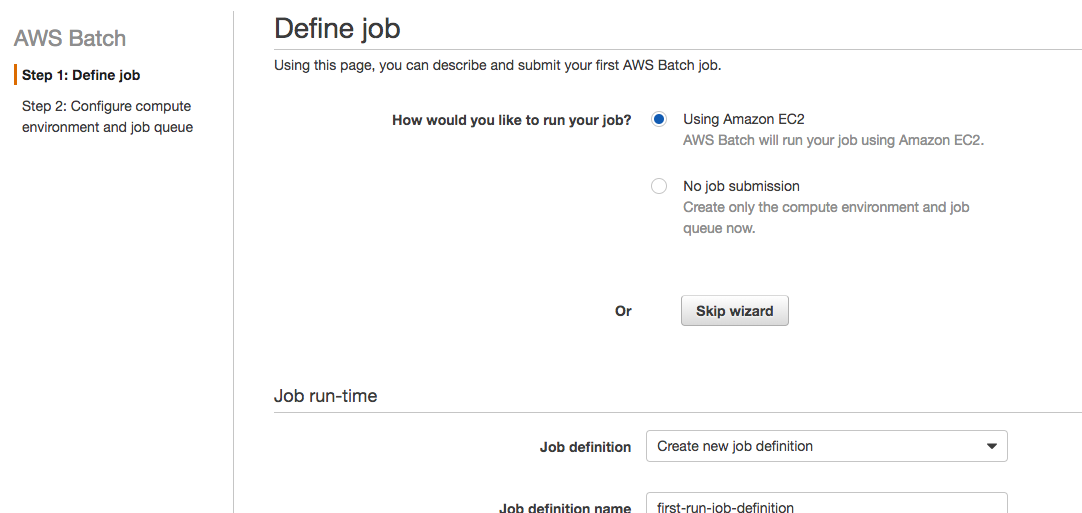
Click the “Get started” button. Then, this next screen will appear:
AWS Batch guide

Click the “Skip wizard” button. We’re not going to follow this wizard because I want to explain each step to you. Also, after this, you’ll probably use AWS CloudFormation or something else to provision, not the wizard.

Create a Compute Environment

The jobs will run on a compute environment. Here, you’ll configure the instance type, family, and some other things that we’ll see in a bit.

It’s important that you know we’re not going to create any instances now. AWS Batch will create one when it’s needed. You can also configure things to create instances right away, speeding up job scheduling, but we won’t tackle that in this post.

Click the “Compute environments” link that appears in the left menu. You’ll see the following screen:

AWS Batch guide instances

Instance Type and Permissions

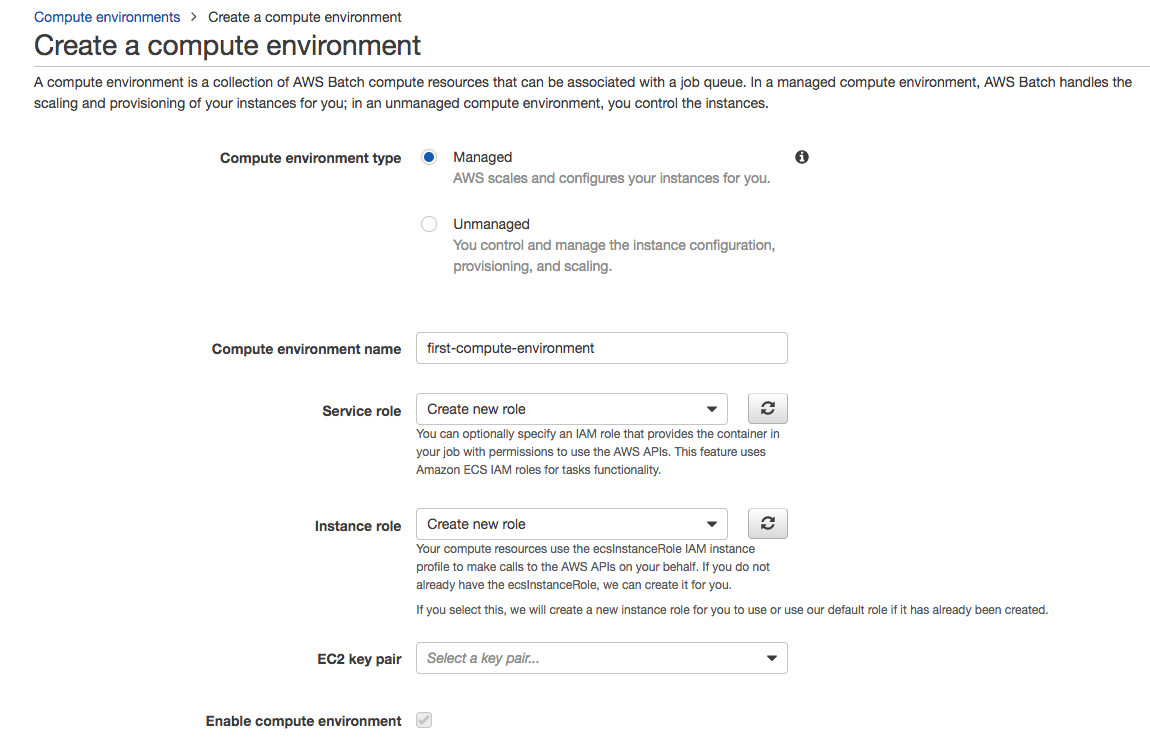
Now click the “Create environment” blue button so you can start defining the compute environment. You’ll start configuring the environment in the following screen:
AWS Batch guide create environment

For simplicity, we’re going to choose all default values. You just need to name the environment. I called it “first-compute-environment.”

You don’t have to worry about creating a service or instance role right now. Just choose the option “Create new role” for both, and AWS will create them for you with the proper permissions. It will help you see which permissions are needed and adjust them if you want to.

Leave the EC2 key pair blank because we don’t need to access the servers for now.

Compute Resources

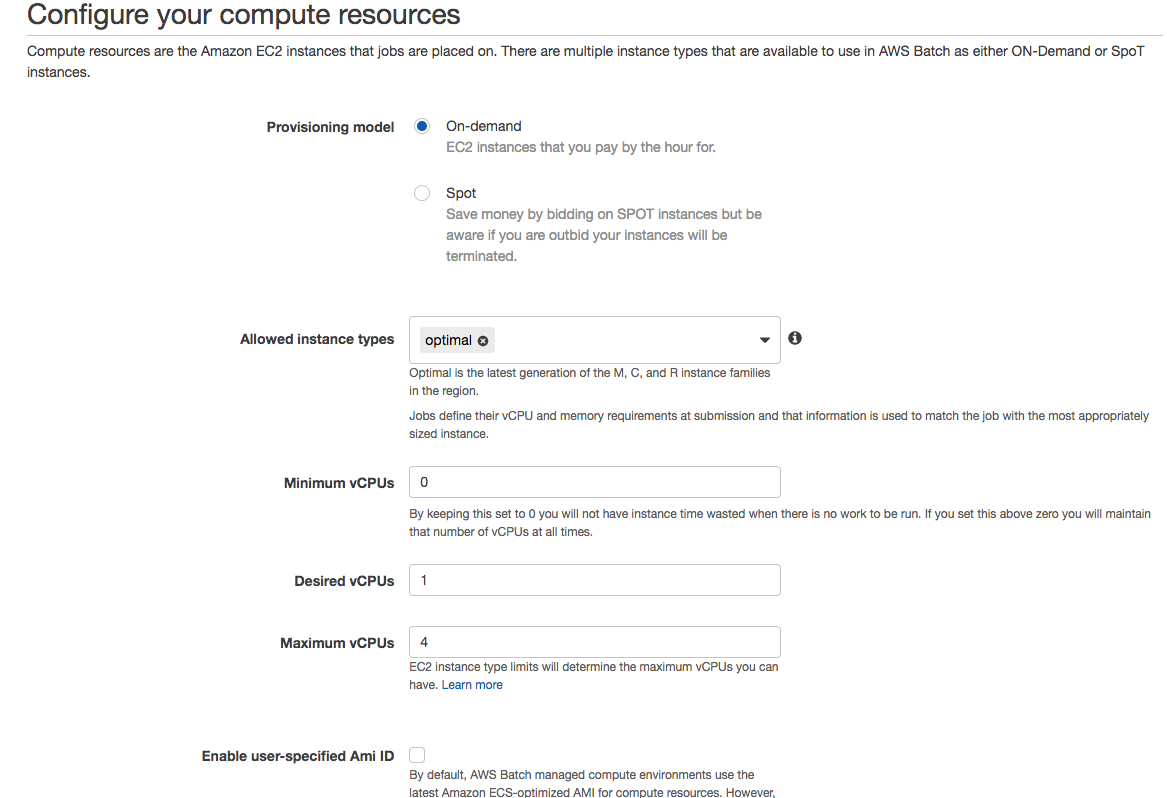
Scroll down a little bit, and let’s talk about the compute resources section. You’ll see the following screen:
AWS Batch guide compute resources

This is where you get to choose if you want to use on-demand or spot instances. For simplicity, let’s choose “On-demand.”

The “Allowed instance types” field is where you define which family type you’d like these environments to create. This is where things get fun because you can create compute environments that are CPU-intensive and choose between C family instance types. Or if there are jobs that are memory intensive, you can choose M family instance types. You’re limiting which instance types can be created. I chose “optimal,” so AWS decides for me which instance is better based on the configuration of job queues.

Now, vCPUs are one of the most important things here in order for your first job to run.

If you’re familiar with running workloads using ECS, you might get confused here. You might configure so many vCPUs that AWS won’t be able to create the environment. And even if there are a few instances running, jobs won’t run until the environment is ready. So keep in mind that vCPUs are virtual CPUs, not CPU units that you configure in a container when running in ECS.

I configured a maximum of four vCPUs. It means that if at some point the cluster has four vCPUs among all instances, it won’t create more. Jobs will run slowly, but your costs will remain controlled. I also put one vCPU as desired, just so it starts creating an instance right now. AWS will adjust this later if needed, and you can change it when submitting a job if you’re in a hurry.

Networking

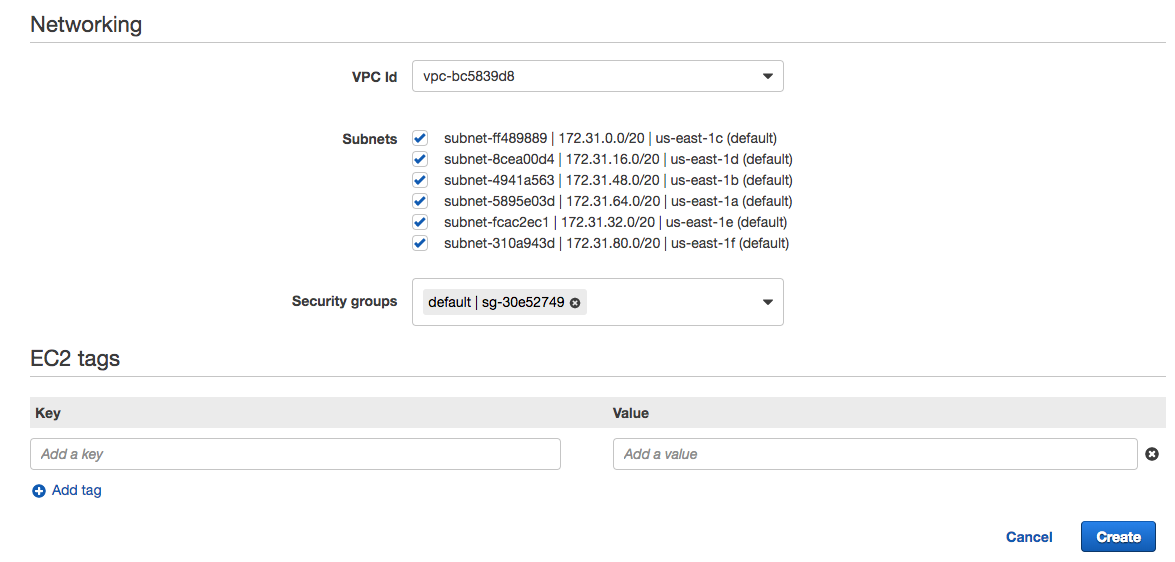
Scroll down a little bit, and you’ll now configure the networking section and tags. You’ll see a screen like this:
AWS Batch guide networking

Leave the VPC and subnets as default for now. Click the “Create” blue button and wait a bit while the environment is created.

AWS Batch guide compute environments

Create a Job Queue

Now you need a queue where you’ll send the jobs to get executed. This queue will be attached to a compute environment so the AWS Batch service will create the resources needed based on the load of the queue. It will use the min, max, and desired vCPUs configuration to know how many instances to create.

Click the “Job queues” link in the left menu and you’ll see the following screen:

AWS Batch guide jon queues

Then, you can click the “Create queue” blue button. You’ll see this:
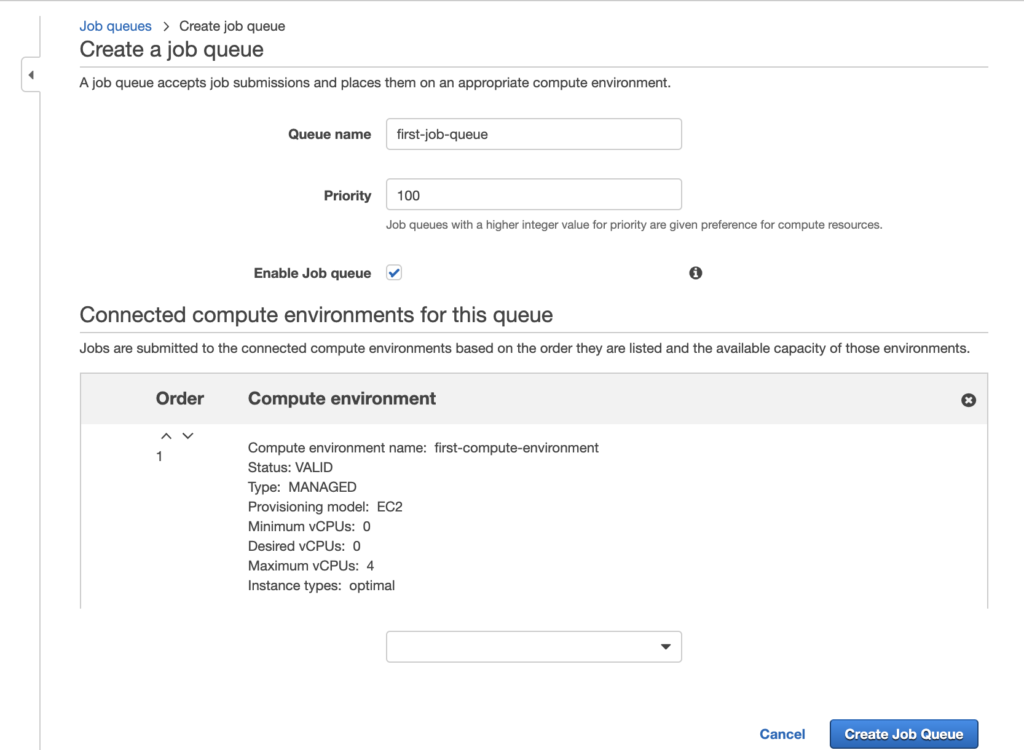
Let’s put a name to the queue so it’s easy to identify. I called it “first-job-queue.”

In the priority, make sure you type a value that lets you play with lower priority queues later. I put “100” in case I need to create a lower priority queue later—say, for example, one with 50.

Enable the job queue. By default, this checkbox will be checked. You should leave it that way.

You now need to connect this queue to one or more compute environments. I chose the one I just created, the “first-compute-environment” one. If there were any other environment, this is where you’d choose it.

Why would I like to have more than one compute environment? Well, it’s useful if you want to speed up a job’s processing time by creating more instances using the spot market. You can have an on-demand compute environment where you always have resources available. And if the load increases, you can create spot instances if there are any available, based on the bid you configured.

Click the “Create queue” blue button.

http://www.hitsubscribe.com/wp-content/uploads/2018/03/Screen-Shot-2018-03-13-at-2.24.36-PM.png

Create a Job Using Docker

We’re going to use a “hello world” job that AWS evangelists have used for demo purposes. I couldn’t find a repository with all the files they’ve used, so I created one with all the files we’re going to need. You can find it on GitHub here.

Let’s explore what’s in there, as well as why and how to use those files to create our first job in AWS Batch.

 Docker Image

We’re going to create a simple job that will pull a Bash script from S3 and execute it. The Dockerfile and the script that does what I just described is located in the “job” folder of the repository.

AWS Batch guide create job

I won’t explain either the script or the Dockerfile just yet—we’ll just use it. So let’s build the Docker image and push it to the Docker hub. You need to have Docker installed on your machine, a Docker hub account, and a login for your computer.

Let’s build the Docker image. You can skip this step and use my image located here, or you can run the following command and tag the image using your username instead of mine:

docker build -t christianhxc/aws-batch-101:latest .

Now, let’s push the image. You need to be logged in with your user ID. And make sure you push the image that has your username in the tag. Run the following command:

docker push christianhxc/aws-batch-101:latest

That’s it! You now have the Docker image that will download a Bash script from S3 and run it.

A Bash Script

Let’s create the Bash script. You can use the one I have in the repo. That script simply puts a Fibonacci sequence in a DynamoDB table. It uses an environment variable called FOO to create the series of numbers, and it uses an argument just to print it in the console.

This script is in the root of the GitHub repository I linked before, and it’s called mapjob.sh

AWS Batch guide bash script

Now, because this is outside the scope of AWS Batch, I’m just going to list the actions you’ll need for this guide to work. We’ll need to do the following:

  1. Create a DynamoDB table in the Virginia region with primary key of “jobID”. Mine is called “fetch_and_run.” If you decide to enter a different name, make sure you change it at the end in the mapjob.sh script.
  2. Create an S3 bucket in the Virginia region. Mine is called “cm-aws-batch-101.” Don’t make it public.
  3. Upload the mapjob.sh script in the bucket you just created.
  4. Create an IAM role for an ECS service task with permissions to the S3 bucket and the DynamoDB table. If you don’t know how to do that, follow these instructions. I called my IAM role “aws-batch-101.” We’ll use this one next.

You’re almost ready to kick off your first job. You already have a script and a Docker image to use.

Let’s create the job definition in AWS and then submit a job.

Create a Job Definition

At this point, you’ve defined the environment where your jobs will run and the queue, which means AWS takes care of creating resources only when they’re needed. Now you need to run the job definition. And this is where things get more interesting.

Click the “Job definitions” link in the left menu and you’ll see the following screen:

AWS Batch guide job definitions

Click the “Create” blue button and let’s start defining the job.
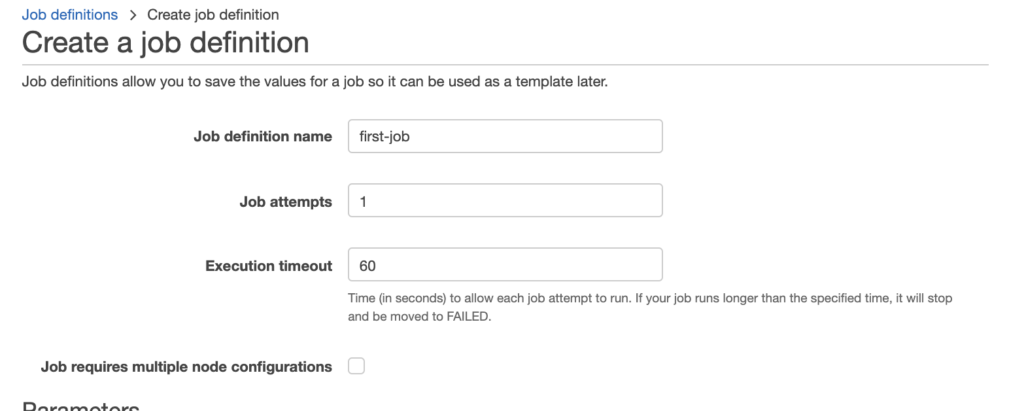
Enter any name you’d like. I put “first-job.” We set job attempts to 1.   Job attempts is the maximum number of times to retry your job if it fails. And Execution timeout, is the maximum number of seconds your job attempts would run. For this example, we set it to 60 seconds.

Scroll down a bit and let me explain what’s there:
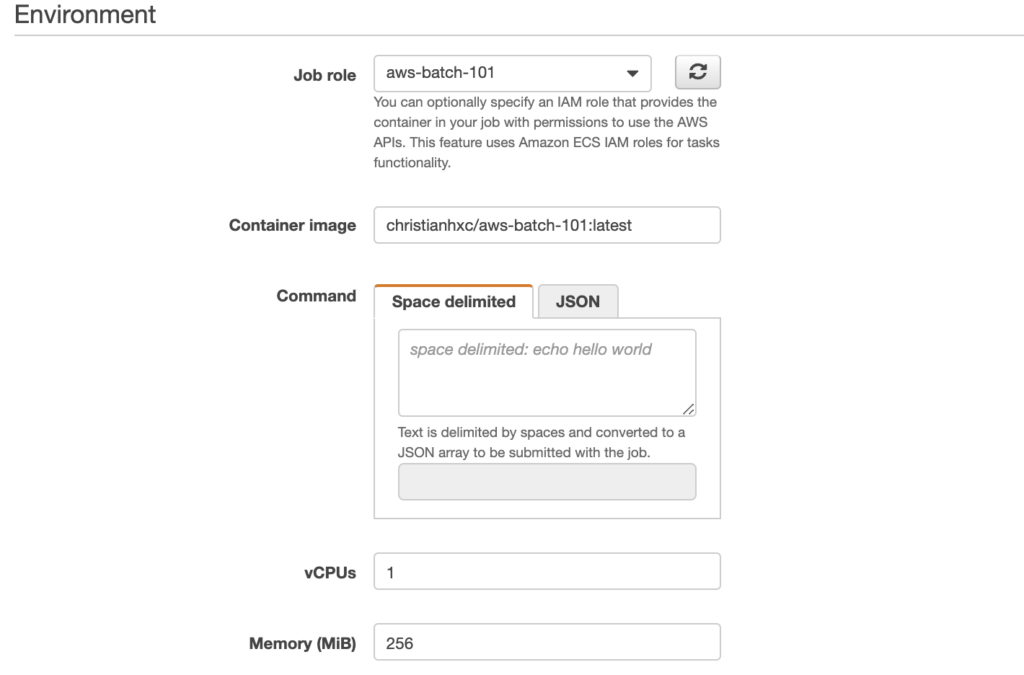
Job role provides a drop down menu where you select the job role. choose the IAM role you created previously; mine is “aws-batch-101.”

Note that:  Only roles with Amazon Elastic Container Service Task Role  trust relationship will be shown. You can learn more about creating roles with AWS ECS trust relationship here.

Now pick a name for the container image. Like I said before, for simplicity, you can use mine. I called it “christianhxc/aws-batch-101:latest.” These values can’t be changed when submitting a job, but the ones we’re about to explore can be changed.

The command field describes the command passed to the container. It maps to the COMMAND parameter to docker run. Here, we’ll type the name of the script that will run the container and its parameters. Because we can override this value, we’ll leave it as it is right now.

Now, here’s another trick to be able to run a job. Unfortunately, you can’t configure CPU units to a container, only vCPUs. It means that, at minimum, the container will have 1024 CPU units because that’s the equivalent to one vCPU. You can configure the CPU, then, in blocks of 1024. This is important because I entered 256, thinking that this was CPU units, and the job never started. It sticks in the RUNNABLE state if there’s nowhere to run it.

Configure how much memory this container will need. I put 256. Leave the rest as it is.

Submit a Job

You’re now, finally, able to submit a job.

Click the “Jobs” link in the left menu, and you’ll see the following screen:

AWS Batch guide jobs

Click the “Submit job” blue button. Let’s submit one!
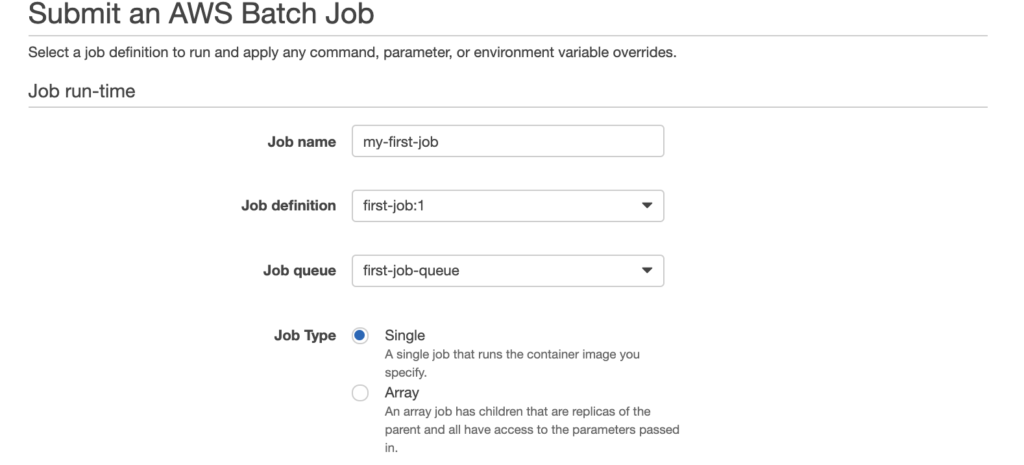
Next, name your job submission. I called it “my-first-job.” Choose the job definition and the queue we just created, and choose “Single” as a job type.

Scroll down a little and let’s override some values here:

In here, you’ll need to put the name of the script in the S3 bucket and the Fibonacci number as parameter. But these are only for reference. I used “mapjob.sh 60.” Type in “1” for vCPU and “256” for memory.

Scroll down some because our scripts need environment variables in order to work. Let’s add the corresponding values:

http://www.hitsubscribe.com/wp-content/uploads/2018/03/Screen-Shot-2018-03-13-at-3.46.47-PM.png

Let’s add the environment variables. For FOO, enter the Fibonacci number. I used 60. For BATCH_FILE_TYPE, put “script”, and for BATCH_FILE_S3_URL, put the S3 URL of the script that will fetch and run.

Click the “Submit job” blue button and wait a while. You can go to the computer environment and changed the desired vCPUs to 1 to speed up the process.

http://www.hitsubscribe.com/wp-content/uploads/2018/03/Screen-Shot-2018-03-13-at-3.52.53-PM.png

It will start creating one instance. When the instance is ready to process a job, the job will transition from RUNNABLE to SUCCEEDED.

http://www.hitsubscribe.com/wp-content/uploads/2018/03/Screen-Shot-2018-03-13-at-3.54.01-PM.png

And you’ll see a new entry in the DynamoDB table.

http://www.hitsubscribe.com/wp-content/uploads/2018/03/Screen-Shot-2018-03-13-at-3.55.38-PM.png

You can keep submitting jobs and change the FOO var to generate a different sequence of numbers. When you don’t submit any other job, AWS Batch will terminate the instance it created.

Thursday, 1 August 2024

Unveiling the Latest Features of the Azure Native New Relic Service

Unveiling the Latest Features of the Azure Native New Relic Service

The Azure Native New Relic Service is a cloud native deep integration experience for Azure and New Relic’s joint customers. Using this experience, you can easily provision, manage, and tightly integrate the New Relic service on Azure. This service allows you to monitor Azure resources and diagnose possible issues by sending logs and metrics to your New Relic .

With this partnership we are looking to further enhance the user experience by introducing the following capabilities that will help you monitor your Azure resources with ease.

  1. Multi-subscription monitoring using a single New Relic resource
  2. Connected New Relic Resources experience in Azure portal 
  3. Suggest a feature in Azure resource overview blade

Multi-subscription monitoring using a single New Relic resource

With this capability, you can now monitor all your subscriptions through a single New Relic resource. This simplifies your experience as you do not have to setup a New Relic resource in every subscription that you intend to monitor.

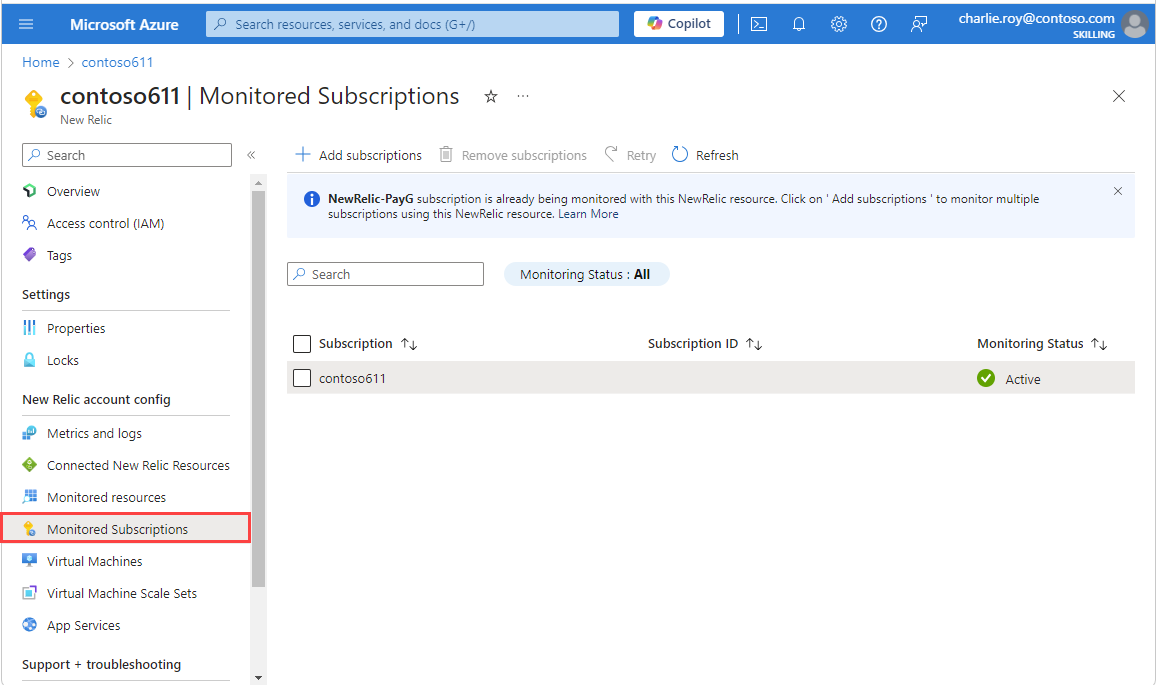
To use this feature, browse to your Azure Native New Relic resource and select Monitored Subscriptions on the left navigation blade under the New Relic account config section.

thumbnail image 1 of blog post titled 


							What’s New? Unveiling the Latest Features of the Azure Native New Relic Service


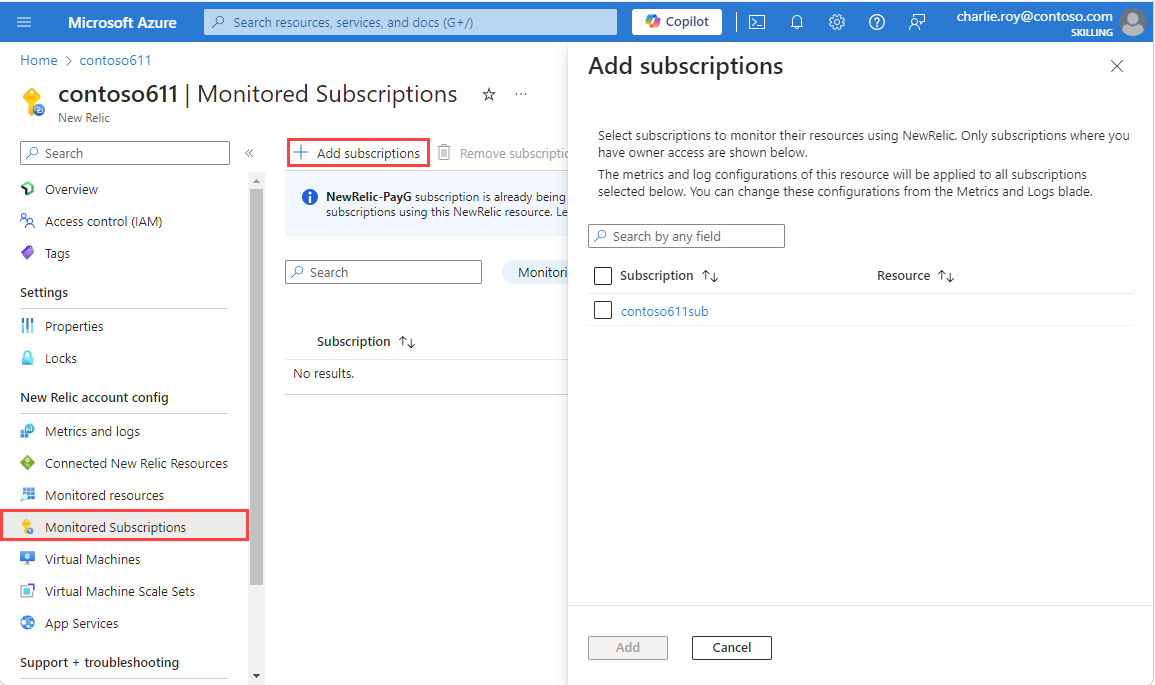
The subscription where this resource is present is monitored by default. Click on the Add subscriptions button to add more subscriptions that you would like to monitor. You will be able to view the subscriptions where you are listed as the owner.

thumbnail image 2 of blog post titled 


							What’s New? Unveiling the Latest Features of the Azure Native New Relic Service


thumbnail image 3 of blog post titled 


							What’s New? Unveiling the Latest Features of the Azure Native New Relic Service


The tag rules and logs that you have defined for the New Relic resource will be applied to all the subscriptions that you have selected to be monitored. If you would like to reconfigure the tag rules, you can follow the steps described here.

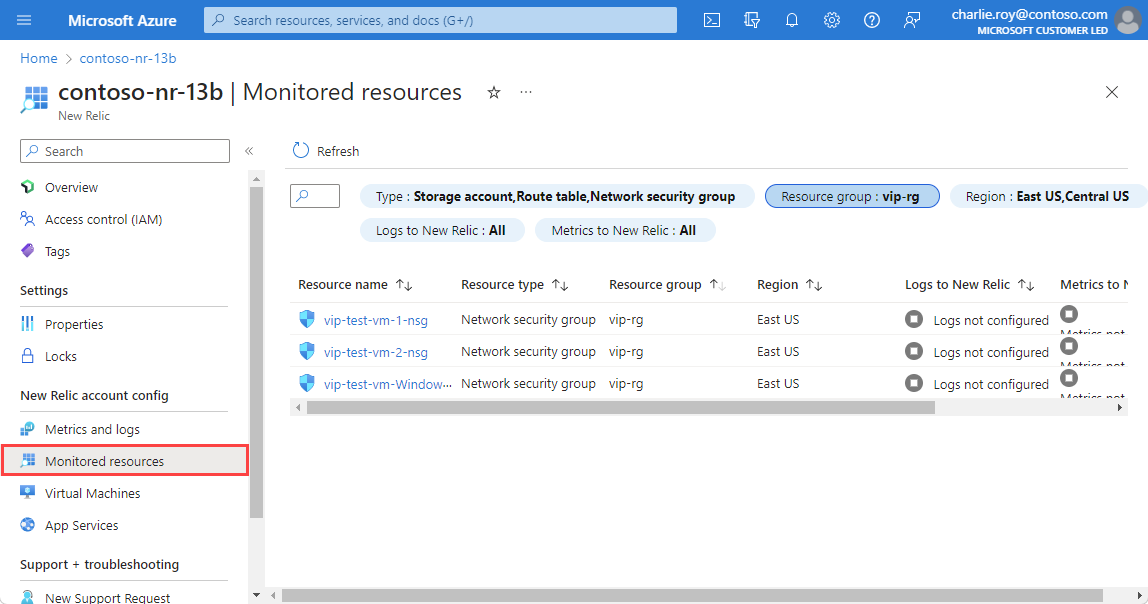
Now you can browse to the Monitored Resources blade in your New Relic resource and select the subscription for which you would like to check the status of the logs and metrics for the resources being sent to the New Relic resource. You can filter by the subscription for which you would like to list all the monitored resources.

thumbnail image 4 of blog post titled 


							What’s New? Unveiling the Latest Features of the Azure Native New Relic Service


Similarly, the agent management experience for App Services and Virtual Machines can span different subscriptions. In the example below, you can view the App Services agent management experience for the different subscriptions which you have selected.

thumbnail image 5 of blog post titled 


							What’s New? Unveiling the Latest Features of the Azure Native New Relic Service


For more information about the following capabilities, you can refer to the following articles Monitor Virtual Machines using the New Relic agent and Monitor App Services using the New Relic agent.  

If you would like to stop monitoring the resources in a particular subscription at any time you can browse to the Monitored Subscriptions blade, select the subscription for which you would like to stop monitoring, and then select Remove subscription. The subscription where the New Relic resource has been created cannot be removed.

thumbnail image 6 of blog post titled 


							What’s New? Unveiling the Latest Features of the Azure Native New Relic Service


Connected New Relic Resources experience in Azure portal

Customers can setup New Relic resources from the Azure portal across multiple subscriptions through the Azure Native New Relic Service. While customers can view a unified bill across the resources which have been created, there is still a need to have a consolidated view of all the Azure resources which have been created through the Azure Native New Relic Service. This experience will help in easy management of the Azure resources in a single view instead of switching across multiple resources.

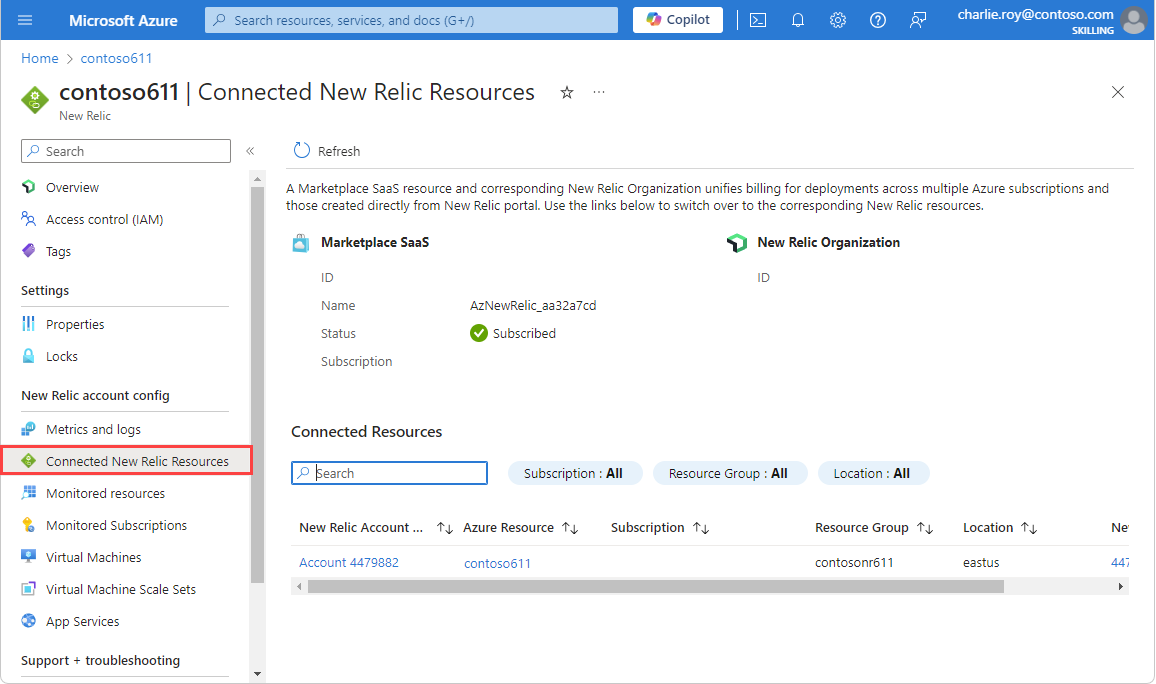
Considering this, we are happy to announce the Connected New Relic Resources blade within your Azure Native New Relic resource.

thumbnail image 7 of blog post titled 


							What’s New? Unveiling the Latest Features of the Azure Native New Relic Service


This new experience will be made available for all the Azure Native New Relic resources within the Azure portal. This will cover all the New Relic resources which are created across Azure subscriptions or from the New Relic portal.

With this experience, you can switch to your New Relic resource deployment experience within the New Relic portal by selecting the links present in the column New Relic Account ID. Similarly, you can also switch between multiple New Relic resources across Azure subscriptions by using the links present in the Azure Resource column. You would be able to access the other resources only if you have the owner or contributor rights to manage the resource.

Suggest a feature

We are always looking for ways to improve our product experience. We would love to hear your suggestions for new features or enhancements you would like to see. To suggest a new feature, you can click on Suggest a Feature in your New Relic resource’s overview blade. This redirects to the Developer community forum where you can also view other feature suggestions from other customers, and you can also upvote other posts and comment on them.

thumbnail image 8 of blog post titled 


							What’s New? Unveiling the Latest Features of the Azure Native New Relic Service


Next steps

  • If you would like to subscribe to the service, select the following New Relic Marketplace item
  • If you are a user of the Azure Native New Relic Service and have feedback or feature requests, please share in our feedback forum
  • To learn more about the service, refer our documentation

Wednesday, 31 July 2024

Manage Azure Native New Relic Service

Manage Azure Native New Relic Service

Resource overview

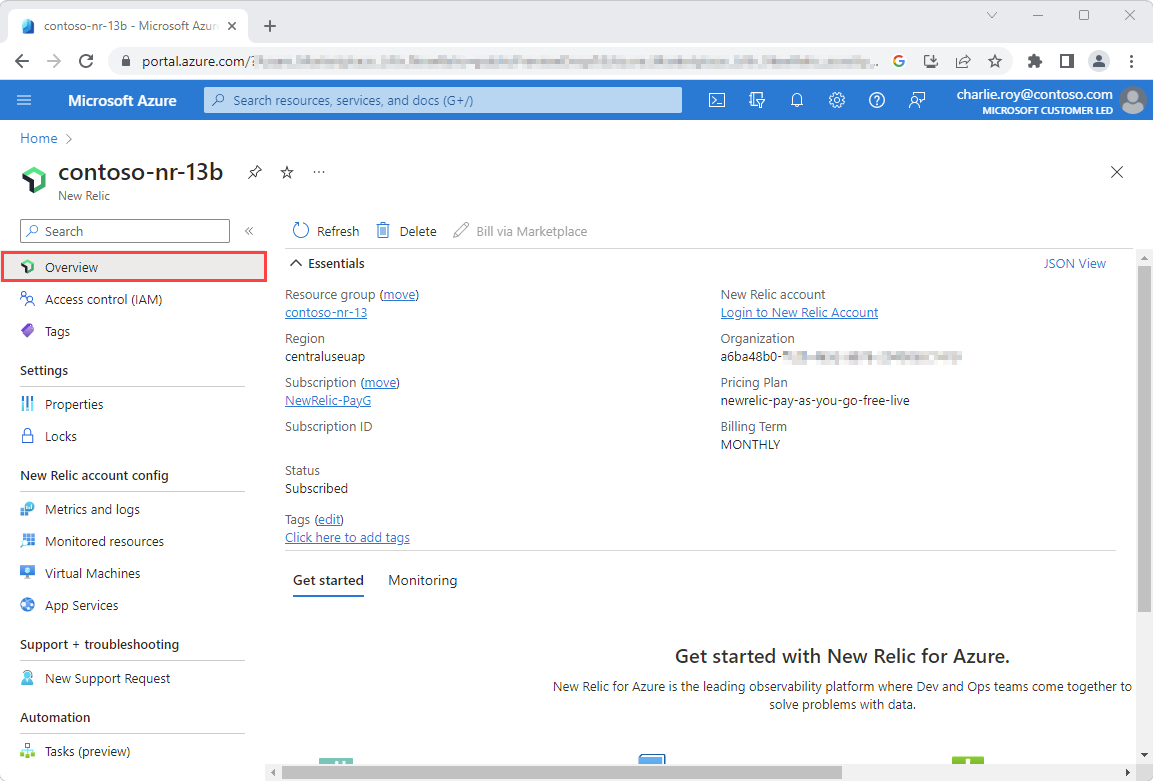
To see the details of your New Relic resource, select Overview on the left pane.

Screenshot that shows an overview for a New Relic resource.

The details include:

  • Resource group
  • Region
  • Subscription
  • Tags
  • New Relic account
  • New Relic organization
  • Status
  • Pricing plan
  • Billing term

At the bottom:

  • The Get started tab provides deep links to New Relic dashboards, logs, and alerts.
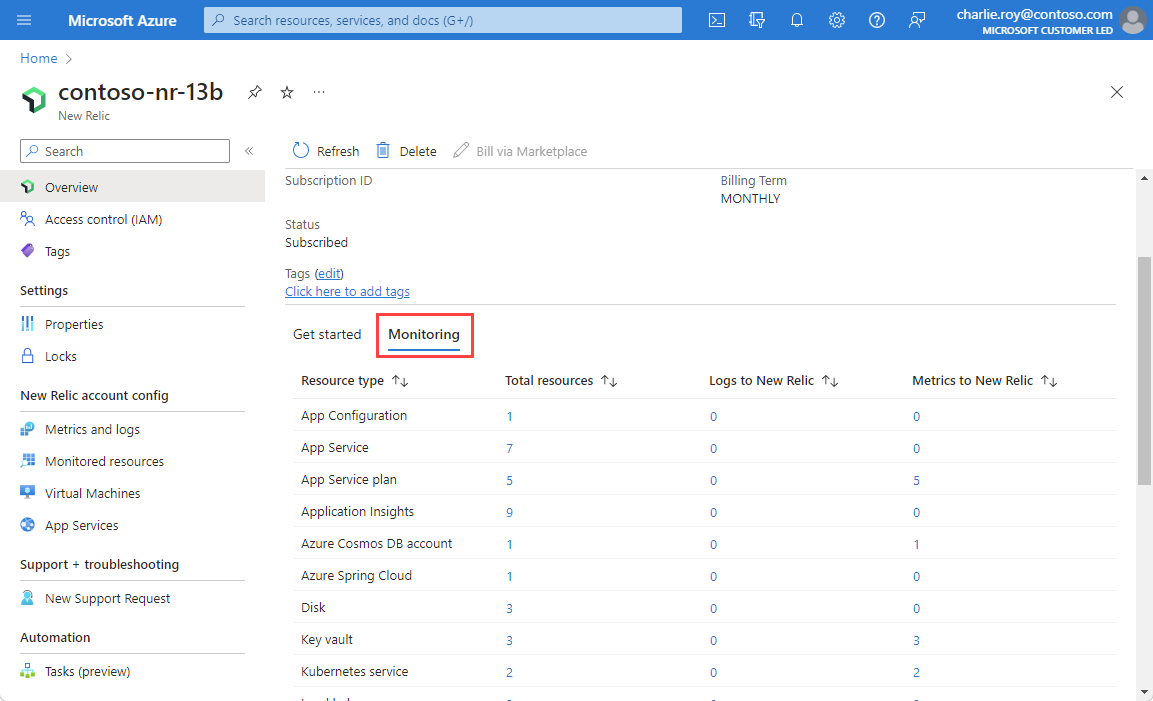
  • The Monitoring tab provides a summary of the resources that send logs and metrics to New Relic.

If you select Monitored resources, the pane that opens includes a table with information about the Azure resources that are sending logs and metrics to New Relic.

Screenshot showing a table of monitored resources below properties.

The columns in the table denote valuable information for your resource:

PropertyDescription
Resource typeAzure resource type
Total resourcesCount of all resources for the resource type
Logs to New RelicCount of logs for the resource type
Metrics to New RelicCount of resources that are sending metrics to New Relic through the integration

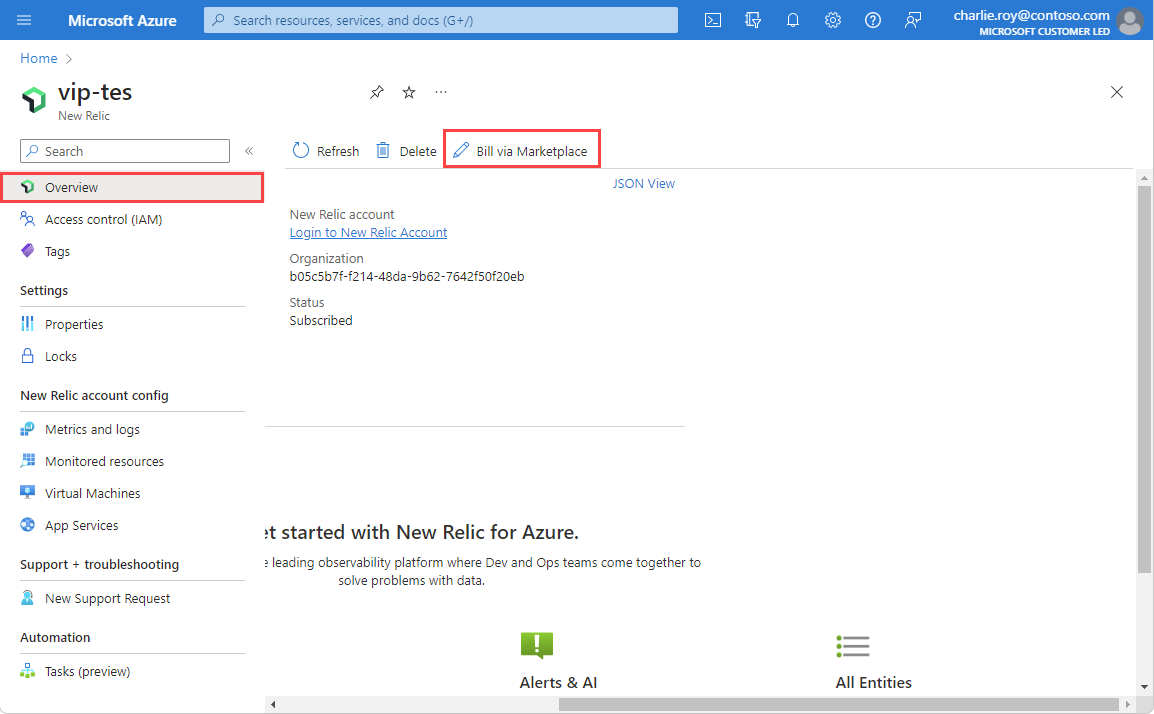
If New Relic currently manages billing and you want to change to Azure Marketplace billing to consume your Azure commitment, you should work with New Relic to align on timeline as per the current contract tenure. Then, switch your billing using the Bill via Marketplace from the working pane of the Overview page or your New Relic resource.

Screenshot with 'Bill via Azure Marketplace' selection highlighted.

Reconfigure rules for logs or metrics

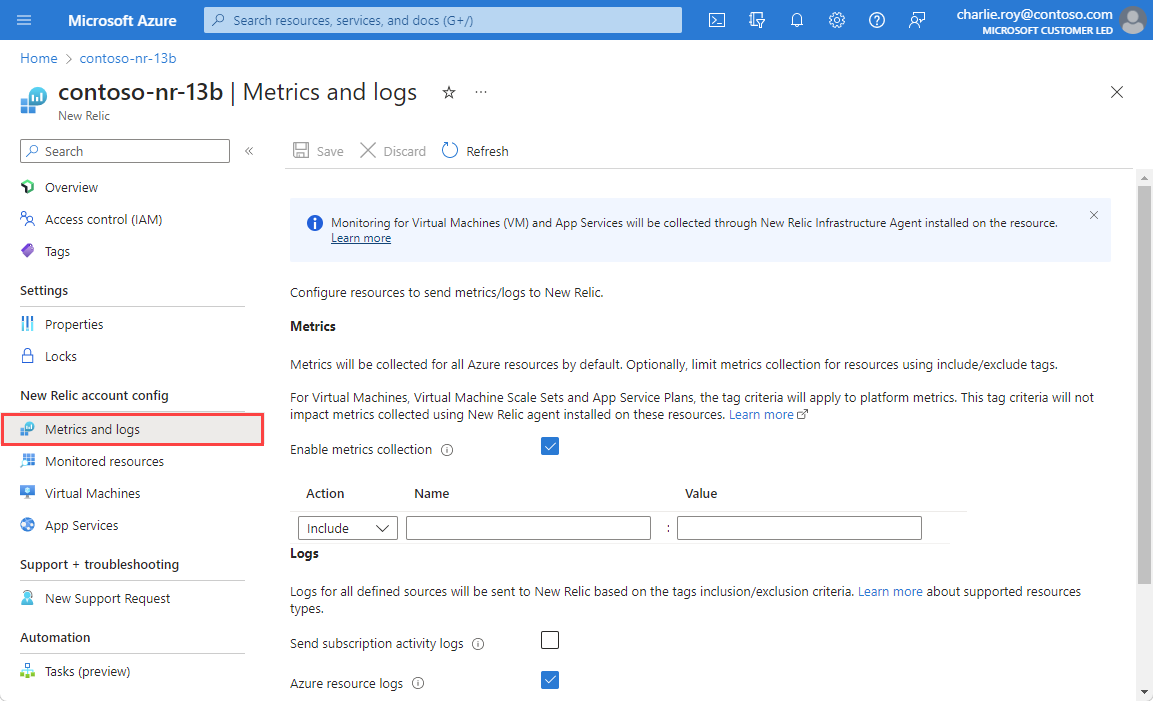
To change the configuration rules for logs or metrics, select Metrics and Logs in the Resource menu.

Screenshot that shows metrics and logs for a New Relic resource.

For more information, see Configure metrics and logs.

View monitored resources

To see the list of resources that are sending metrics and logs to New Relic, select Monitored resources on the left pane.

Screenshot that shows monitored resources for a New Relic resource.

You can filter the list of resources by resource type, resource group name, region, and whether the resource is sending metrics and logs.

The column Logs to New Relic indicates whether the resource is sending logs to New Relic. If the resource isn't sending logs, the reasons could be:

  • Resource does not support sending logs: Only resource types with monitoring log categories can be configured to send logs. See Supported categories.
  • Limit of five diagnostic settings reached: Each Azure resource can have a maximum of five diagnostic settings. For more information, see Diagnostic settings.
  • Error: The resource is configured to send logs to New Relic but an error blocked it.
  • Logs not configured: Only Azure resources that have the appropriate resource tags are configured to send logs to New Relic.
  • Agent not configured: Virtual machines or app services without the New Relic agent installed don't send logs to New Relic.

The column Metrics to New Relic indicates whether New Relic is receiving metrics that correspond to this resource.

Monitor multiple subscriptions

You can now monitor all your subscriptions through a single New Relic resource using Monitored Subscriptions. Your experience is simplified because you don't have to set up a New Relic resource in every subscription that you intend to monitor. You can monitor multiple subscriptions by linking them to a single New Relic resource that is tied to a New Relic organization. This provides a single pane view for all resources across multiple subscriptions.

To manage multiple subscriptions that you want to monitor, select Monitored Subscriptions in the New Relic New Relic organization configurations section of the Resource menu.

Screenshot showing Monitored Subscriptions selected in the Resource menu.

From Monitored Subscriptions in the Resource menu, select the Add Subscriptions. The Add Subscriptions experience that opens and shows the subscriptions you have Owner role assigned to and any New Relic resource created in those subscriptions that is already linked to the same New Relic organization as the current resource.

If the subscription you want to monitor has a resource already linked to the same New Relic org, we recommended that you delete the New Relic resources to avoid shipping duplicate data, and incurring double the charges.

Select the subscriptions you want to monitor through the New Relic resource and select Add.

Screenshot showing subscriptions to add.

If the list doesn’t get updated automatically, select Refresh to view the subscriptions and their monitoring status. You might see an intermediate status of In Progress while a subscription gets added. When the subscription is successfully added, you see the status is updated to Active. If a subscription fails to get added, Monitoring Status shows as Failed.

Screenshot showing statuses of monitored subscriptions.

The set of tag rules for metrics and logs defined for the New Relic resource apply to all subscriptions that are added for monitoring. Setting separate tag rules for different subscriptions isn't supported. Diagnostics settings are automatically added to resources in the added subscriptions that match the tag rules defined for the New Relic resource.

If you have existing New Relic resources that are linked to the account for monitoring, you can end up with duplication of logs that can result in added charges. Ensure you delete redundant New Relic resources that are already linked to the account. You can view the list of connected resources and delete the redundant ones. We recommended to consolidate subscriptions into the same New Relic resource where possible.

The tag rules and logs that you defined for the New Relic resource are applied to all the subscriptions that you select to be monitored. If you would like to reconfigure the tag rules, you can follow the steps described here.

For more information about the following capabilities, see Monitor Virtual Machines using the New Relic agent and Monitor App Services using the New Relic agent.

Connected New Relic resources

To access all New Relic resources and deployments you created using the Azure or New Relic portal experience, go to the Connected New Relic resources tab in any of your Azure New Relic resources.

Screenshot showing Connected New Relic resources selected in the Resource menu.

You can easily manage the corresponding New Relic deployments or Azure resources using the links, provided you have owner or contributor rights to those deployments and resources.

Monitor virtual machines by using the New Relic agent

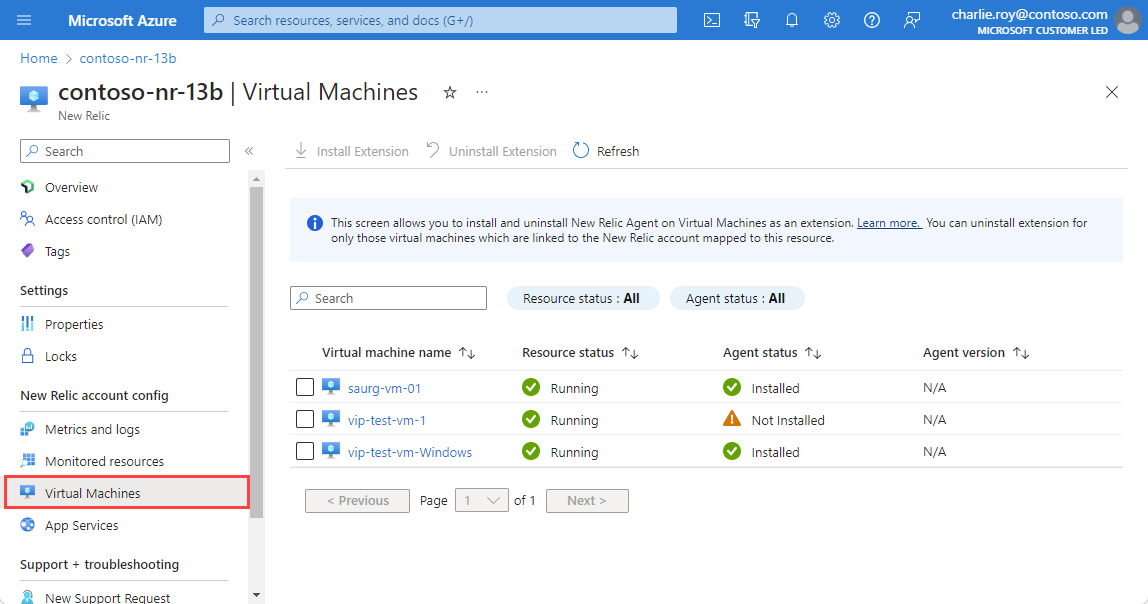
You can install the New Relic agent on virtual machines as an extension. Select Virtual Machines on the left pane. The Virtual machine agent pane shows a list of all virtual machines in the subscription.

Screenshot that shows virtual machines for a New Relic resource.

For each virtual machine, the following info appears:

PropertyDescription
Virtual machine nameName of the virtual machine.
Resource statusIndicates whether the virtual machine is stopped or running. The New Relic agent can be installed only on virtual machines that are running. If the virtual machine is stopped, installing the New Relic agent is disabled.
Agent statusIndicates whether the New Relic agent is running on the virtual machine.
Agent versionVersion number of the New Relic agent.

Monitor Azure Virtual Machine Scale Sets by using the New Relic agent

You can install New Relic agent on Azure Virtual Machine Scale Sets as an extension.

  1. Select Virtual Machine Scale Sets under New Relic account config in the Resource menu.
  2. In the working pane, you see a list of all virtual machine scale sets in the subscription.

Virtual Machine Scale Sets is an Azure Compute resource that can be used to deploy and manage a set of identical VMs. For more information, see Virtual Machine Scale Sets.

For more information on the orchestration modes available orchestration modes.

Use native integration to install an agent on both the uniform and flexible scale-sets. The new instances (VMs) of a scale set, in any mode, receive the agent extension during scale-up. Virtual Machine Scale Sets resources in a uniform orchestration mode support AutomaticRolling, and Manual upgrade policy. Resources in Flexible orchestration mode only support manual upgrade.

If a manual upgrade policy is set for a resource, upgrade the instances manually by installing the agent extension for the already scaled up instances. For more information on autoscaling and instance orchestration, see autoscaling-and-instance-orchestration.

Monitor app services by using the New Relic agent

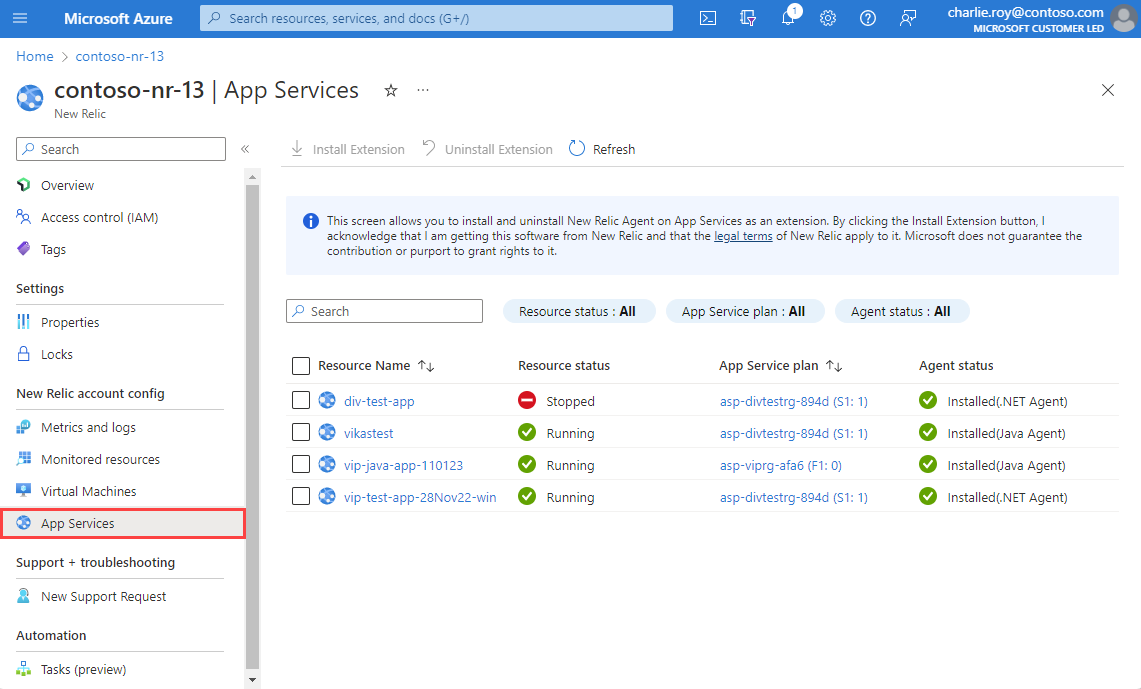
You can install the New Relic agent on app services as an extension. Select App Services on the left pane. The working pane shows a list of all app services in the subscription.

Screenshot that shows app services for a New Relic resource.

For each app service, the following information appears:

PropertyDescription
Resource nameApp service name.
Resource statusIndicates whether the App service is running or stopped. The New Relic agent can be installed only on app services that are running.
App Service planThe plan configured for the app service.
Agent statusStatus of the agent.

To install the New Relic agent, select the app service and then select Install Extension. The application settings for the selected app service are updated, and the app service is restarted to complete the configuration of the New Relic agent.

Delete a New Relic resource

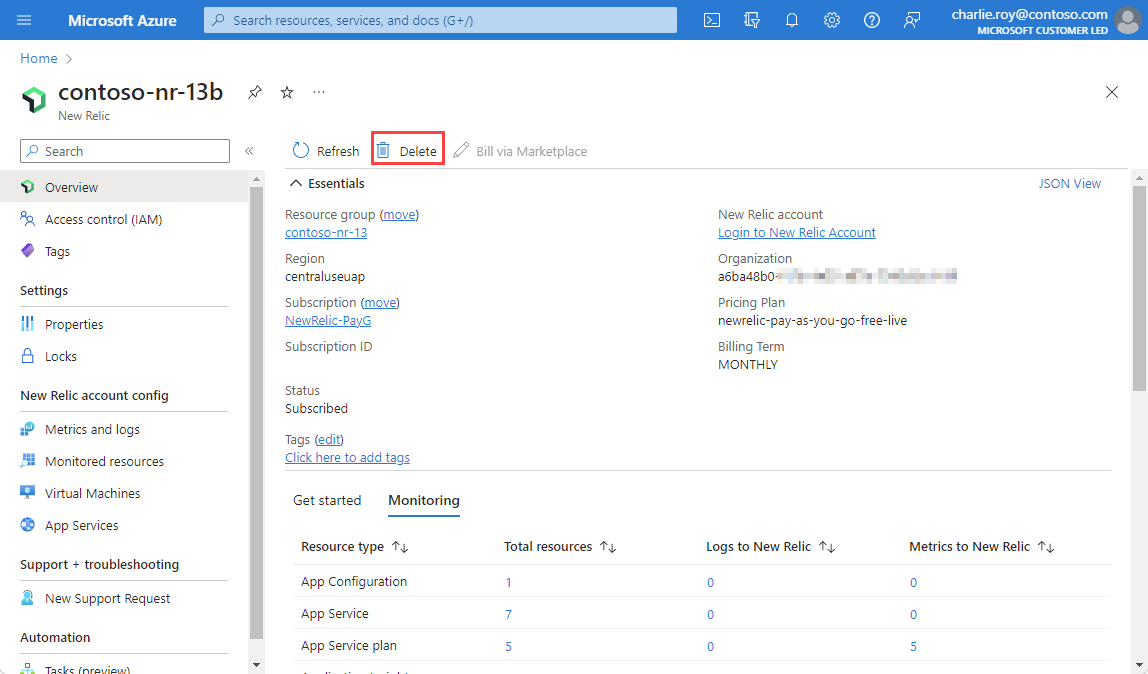
  1. Select Overview on the left pane. Then, select Delete.

    Screenshot of the delete button on a resource overview.

  2. Confirm that you want to delete the New Relic resource. Select Delete.

If only one New Relic resource is mapped to a New Relic account, logs and metrics are no longer sent to New Relic.

For a New Relic organization where billing is managed through Azure Marketplace, deleting the last associated New Relic resource also removes the corresponding Azure Marketplace billing relationship.

If you map more than one New Relic resource to the New Relic account by using the link option, deleting the New Relic resource only stops sending logs for Azure resources associated with that New Relic resource. Because other Azure Native New Relic Service resources are linked with this New Relic account, billing continues through Azure Marketplace.