Wednesday, 31 July 2024

Manage Elastic Cloud (Elasticsearch) - An Azure Native ISV Service


Manage Elastic Cloud (Elasticsearch) - An Azure Native ISV Service

Reconfigure rules for metrics and logs

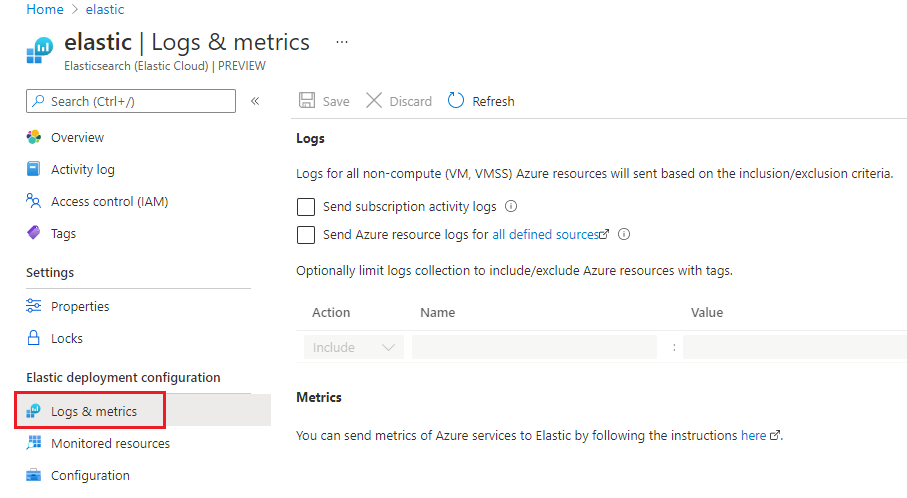
When you created the Elastic resource, you configured which logs are sent to Elastic. If you need to change those settings, select Metrics and Logs in the left pane. Make the needed changes to how logs are sent to Elastic.

For more information about the two types of logs, see QuickStart: Get started with Elastic.
Change log settings

View monitored resources

To see a list of resources sending logs to Elastic, select Monitored Resources in the left pane.

View monitored resources

You can filter the list by resource type, resource group name, location, and whether the resource is sending logs.

The Logs to Elastic column indicates whether the resource is sending Logs to Elastic. If the resource isn't sending logs, this field specifies why logs aren't being sent. The reasons could be:

  • Resource doesn't support sending logs. Only Azure resource logs for all resources types and log categories defined here can be configured to send logs to Elastic
  • Limit of five diagnostic settings reached. Each Azure resource can have a maximum of five diagnostic settings.
  • An error is blocking the logs from being sent to Elastic.
  • Logs aren't configured for the resource. Only resources that have the appropriate resource tags are sent to Elastic. You specified the tag rules in the log configuration.
  • Region isn't supported. The Azure resource is in a region that doesn't currently send logs to Elastic.

Monitor virtual machines using Elastic agent

You can install Elastic agents on virtual machines as an extension. To see the available virtual machines in your subscription, select Virtual Machines from the left pane of your Elastic resource.
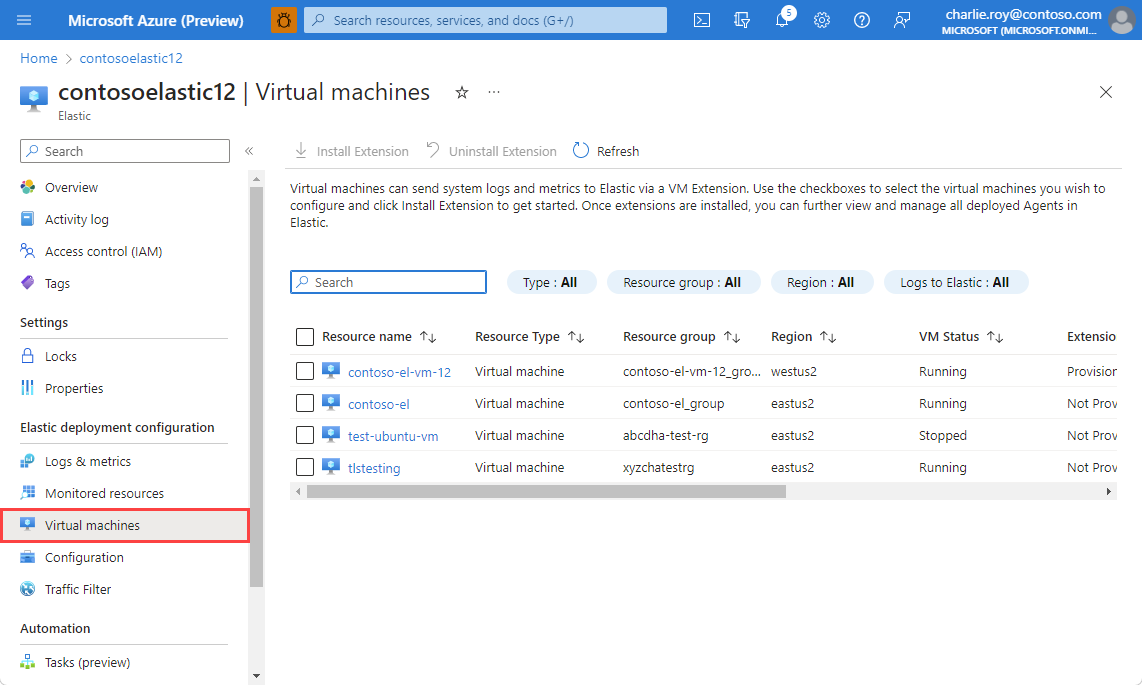
Screenshot showing  a list of virtual machines where you can install the Elastic VM extension and status information.

For each virtual machine, the following data is displayed:

  • Resource Name – Virtual machine name.
  • Resource Status – Whether the virtual machine is stopped or running. The Elastic agent can only be installed on virtual machines that are running. If the virtual machine is stopped, installing the Elastic agent is disabled.
  • Agent version – The Elastic agent version number.
  • Agent status – Whether the Elastic agent is running on the virtual machine.
  • Integrations enabled – The key metrics that are being collected by the Elastic agent.
  • Sending logs – Whether the Elastic agent is sending logs to Elastic.

To install the Elastic agent, select a virtual machine and select Install Extension.
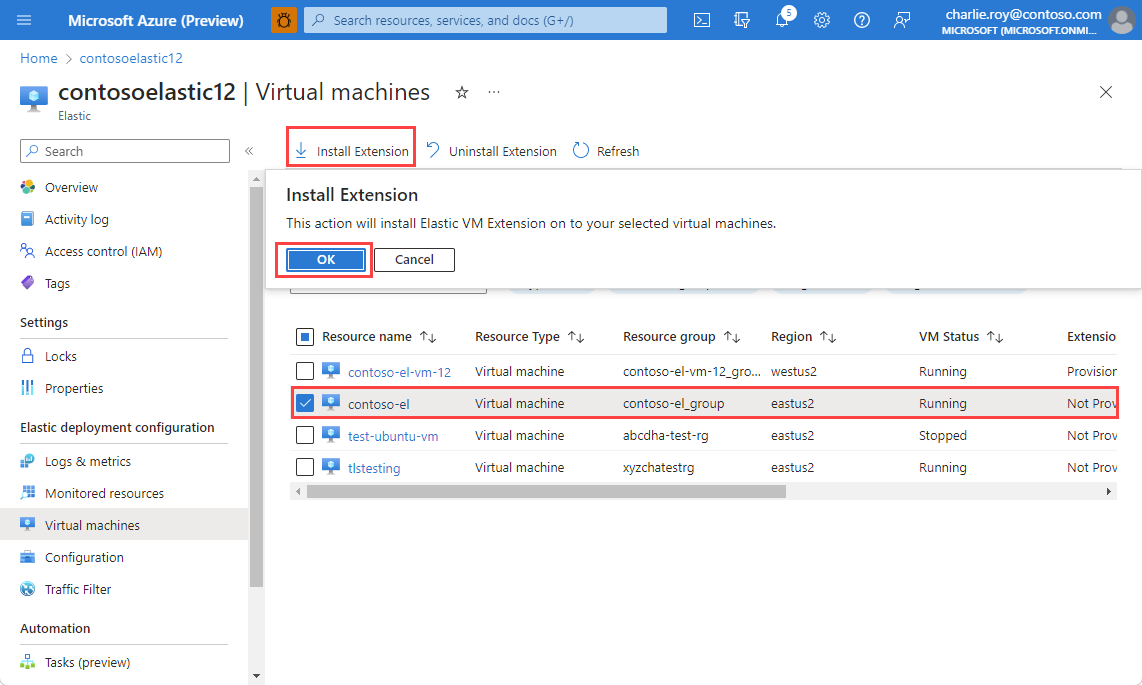
Screenshot showing a virtual machine selected for an installation of the Elastic VM extension.

The portal asks for confirmation that you want to install the agent with the default authentication. Select OK to begin installation. The portal shows the status as Installing until the agent is installed and provisioned.

After the Elastic agent is installed, the status changes to Installed.

To see that the Elastic agent has been installed, select the virtual machine and navigate to Extensions.

To uninstall the Elastic agent on a virtual machine, select the virtual machine and Uninstall Extension.

Configure diagnostic settings

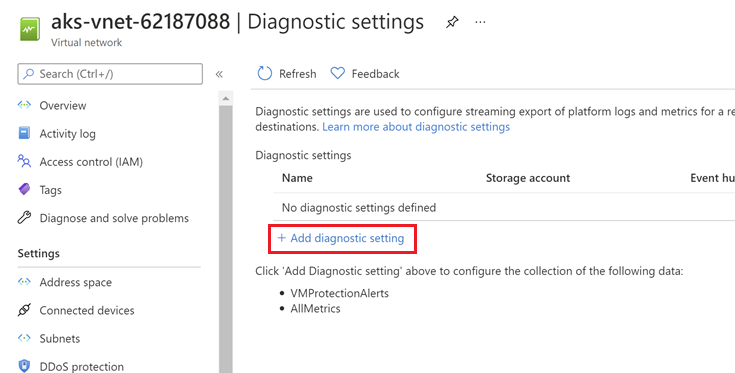
To configure the diagnostic settings for a resource, select that resource. In the left pane, select Diagnostic settings.

In the destination details section, check the option to send to partner solutions to select Elastic as a destination target. The option is only available after an Elastic resource has been created.

Screenshot of configure diagnostic settings.

Configure Azure OpenAI Connector

If not configured already while creating the resource, you can navigate to the Azure OpenAI configuration blade under the Elastic deployment configuration section. Click on Add to select the Azure OpenAI resource and a deployment of a text/chat completion model(like gpt4). This makes it seamless for you to have your connector ready without having to switch contexts between the AOAI resource(in Azure portal) and the Connectors page in Elastic portal, thus avoiding having to copy and paste urls and keys.
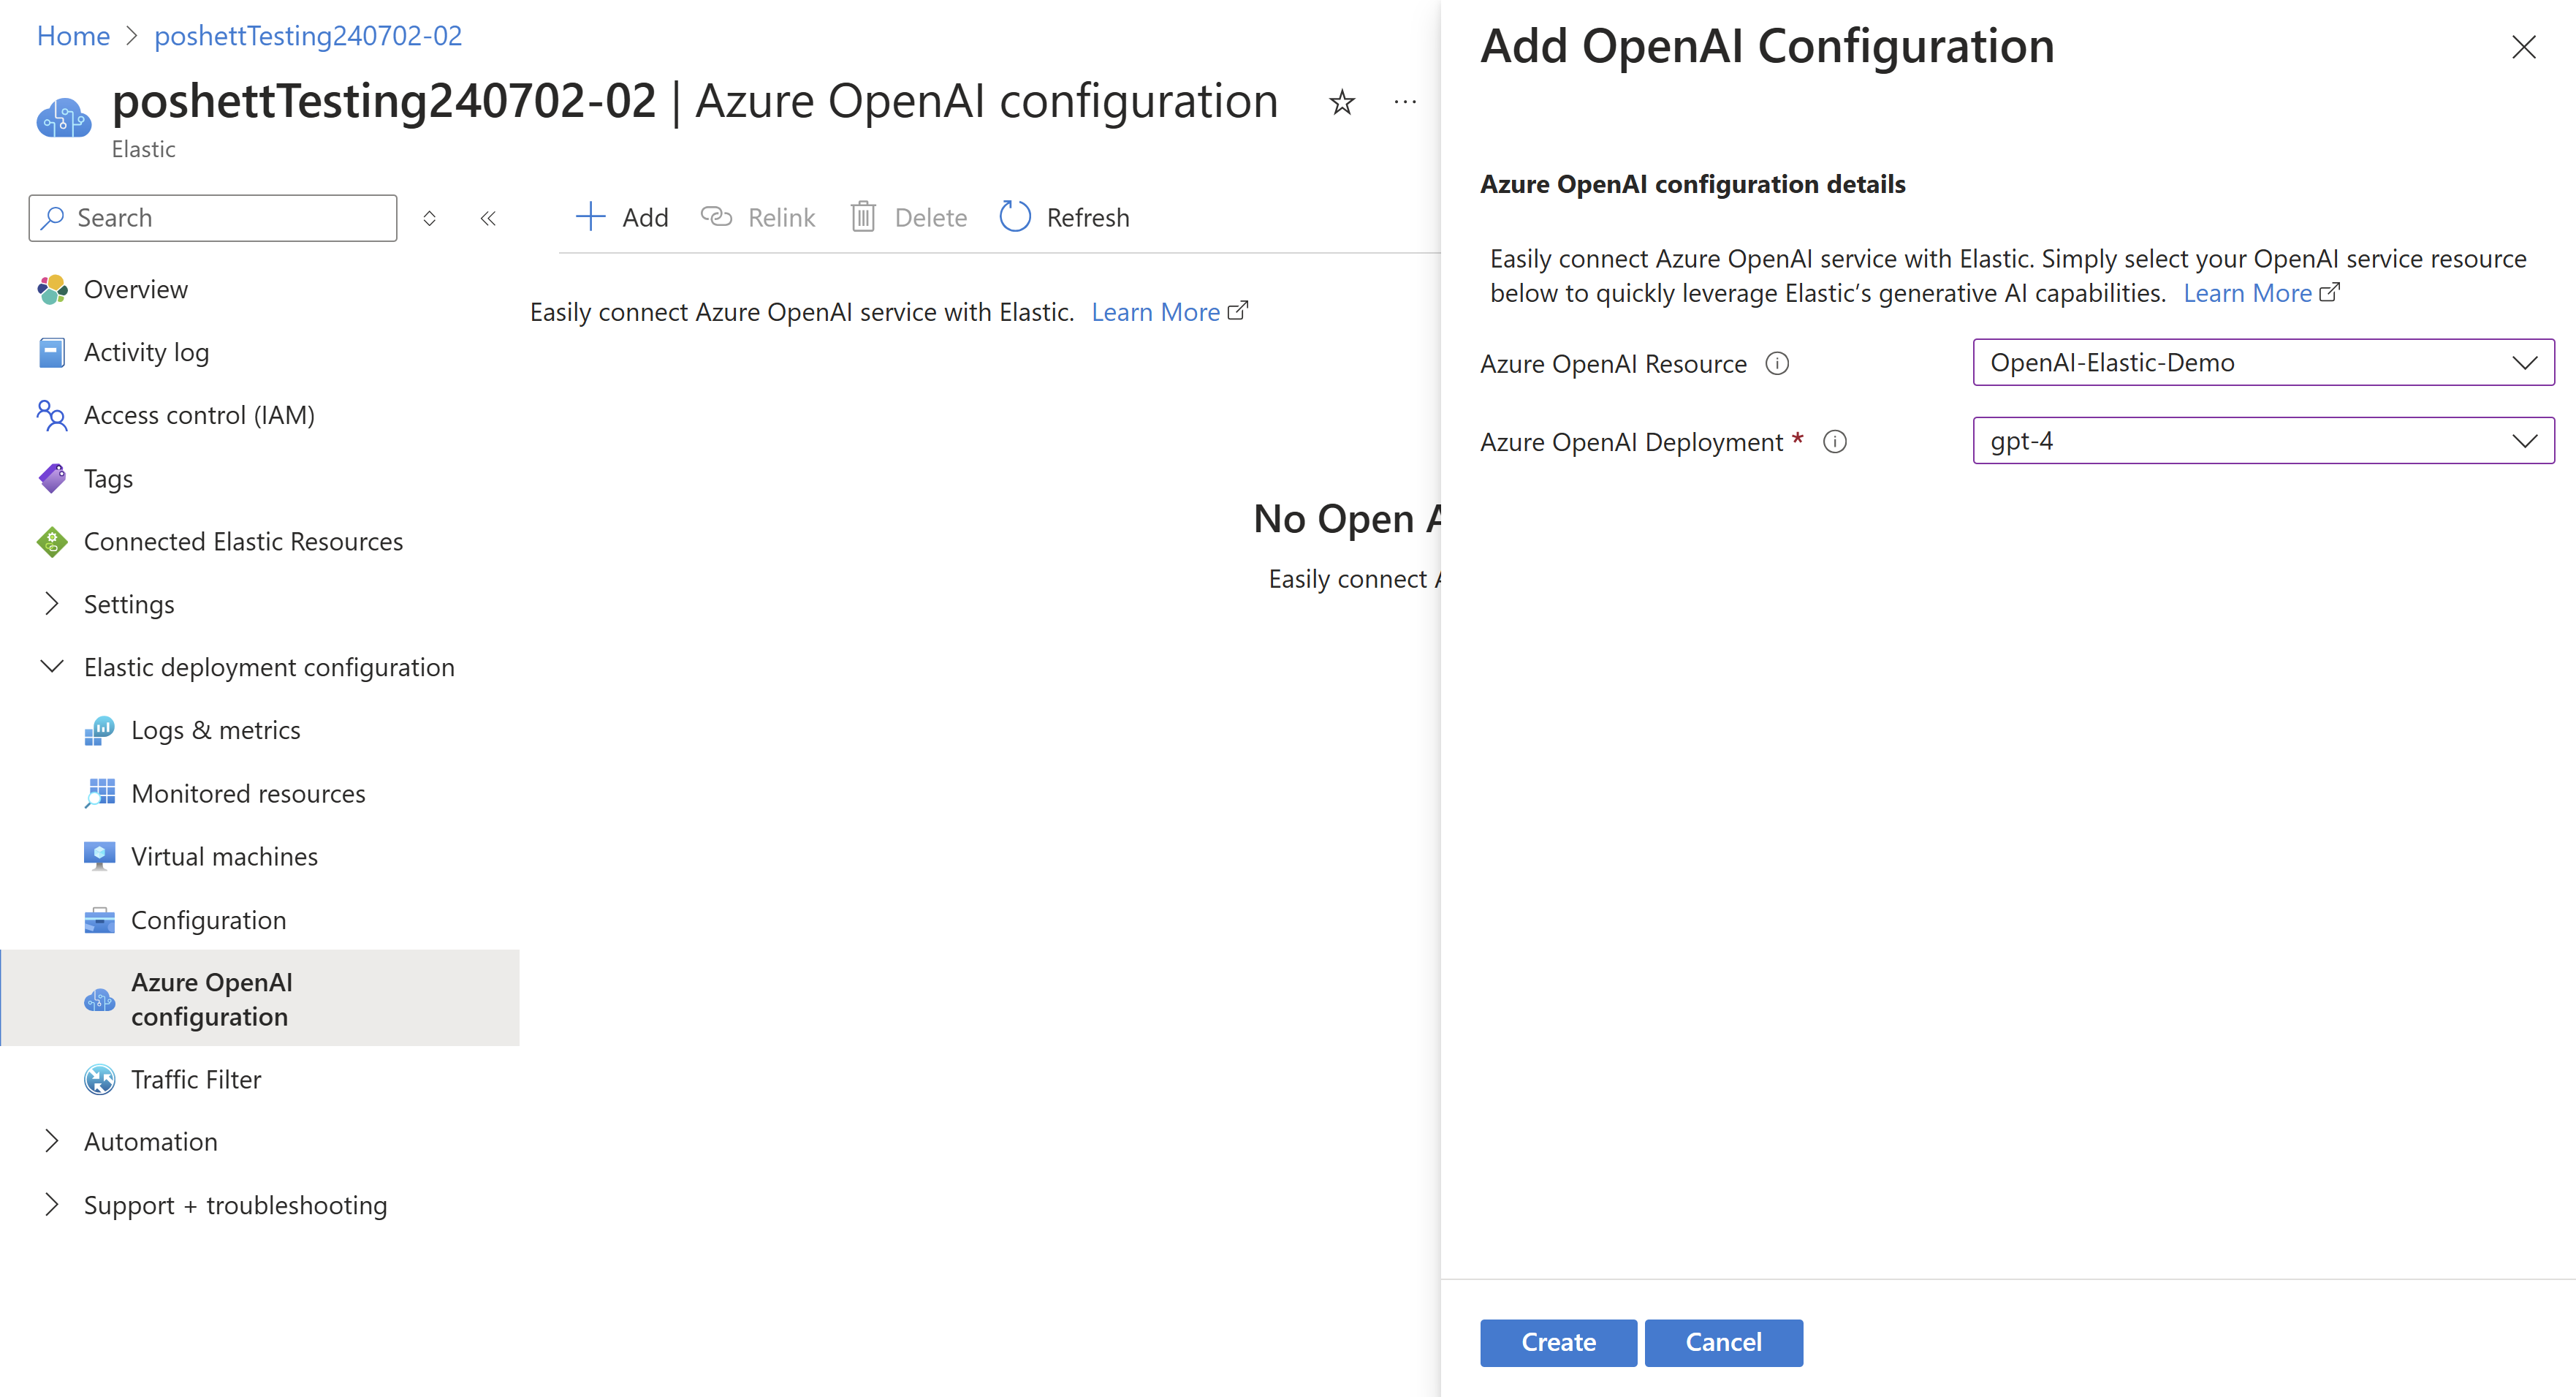
Screenshot of Configure Azure OpenAI Connector.

Click on Create.

Once the Connector is created, navigate to Kibana and search for Connectors under Stack Management. The newly created Azure OpenAI Connector should be visible there. This connector can be used within Elastic's Observability AI Assistant to help provide contextual responses to your natural language prompts on your observability data by invoking the Azure OpenAI deployment. Learn more about Elastic OpenAI Connectors here.

You can limit network access to a private link. To enable private link access, select Configuration in the left navigation. Under Networking, select Private Link and the name of the private link.
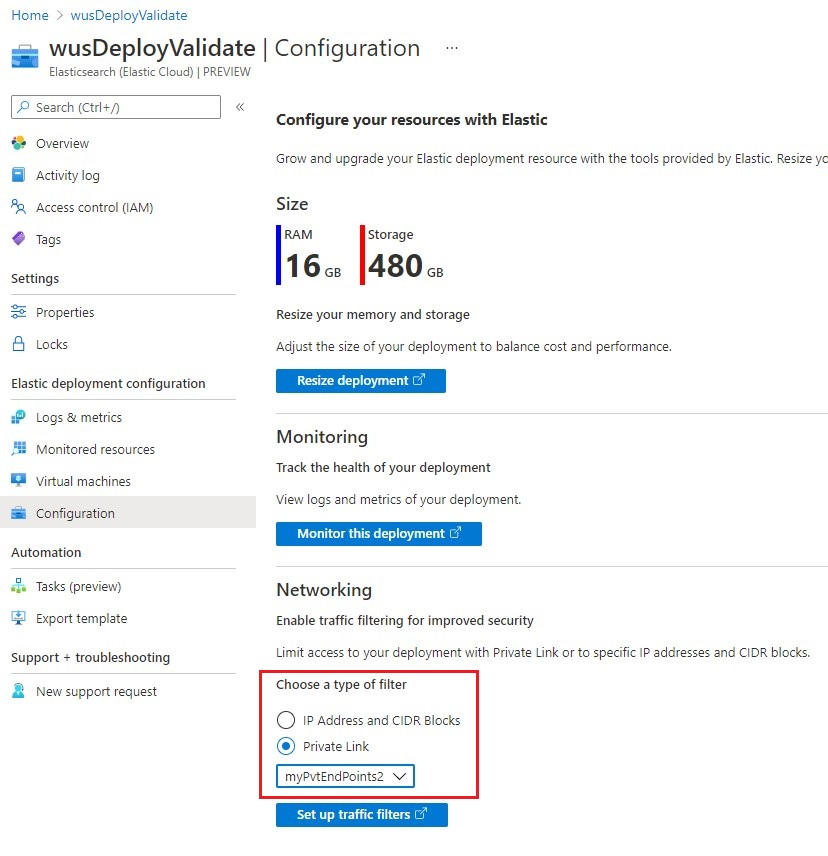
Screenshot of enabling private link

Traffic filters

To manage how Elastic deployments can be accessed, you can set Traffic filters for Azure Private Links.
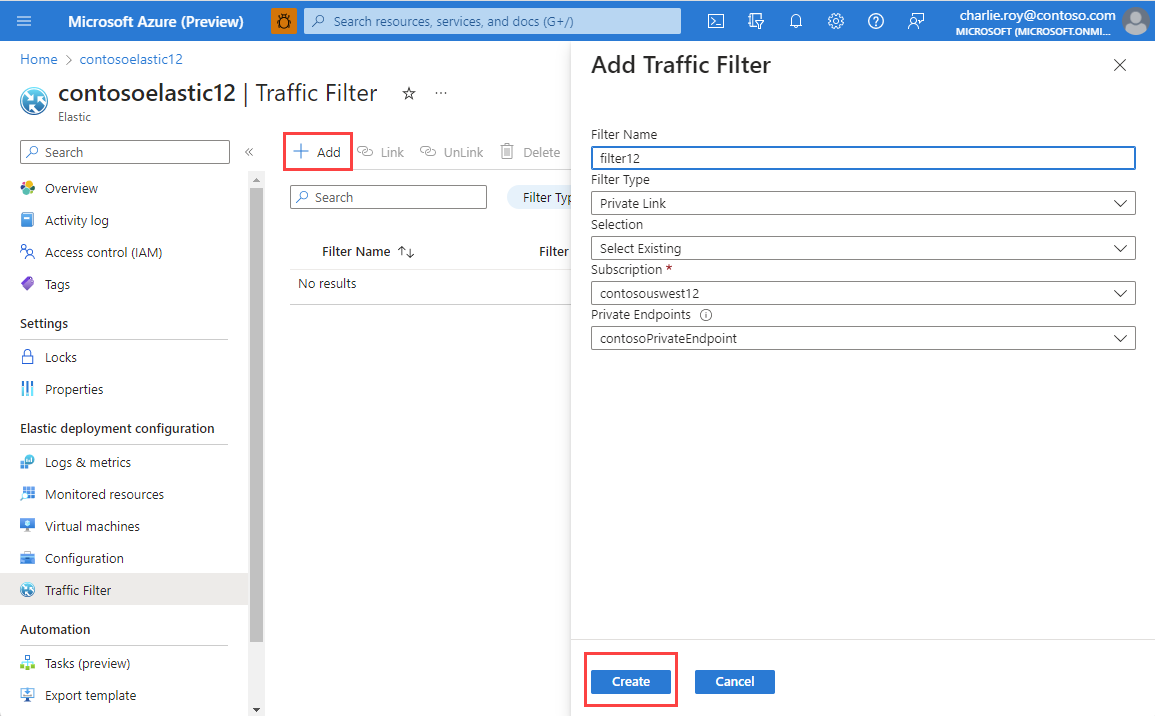
Screenshot showing Traffic Filter selected in the Resource menu.

There are two types of filters available:

  • IP traffic filter
  • Private Link traffic filter

Select Add to set up and automatically associate a new traffic filter to and Elastic deployment.

To associate an already existing traffic filter to the current deployment, you select Link. The traffic filter must be in the same region as the deployment.

If a traffic filter is no longer needed, unlink it from deployment and then delete it.

Connected Elastic resources

To access all Elastic resources and deployments you have created using the Azure or Elastic portal experience, go to the Connected Elastic resources tab in any of your Azure Elastic resources.
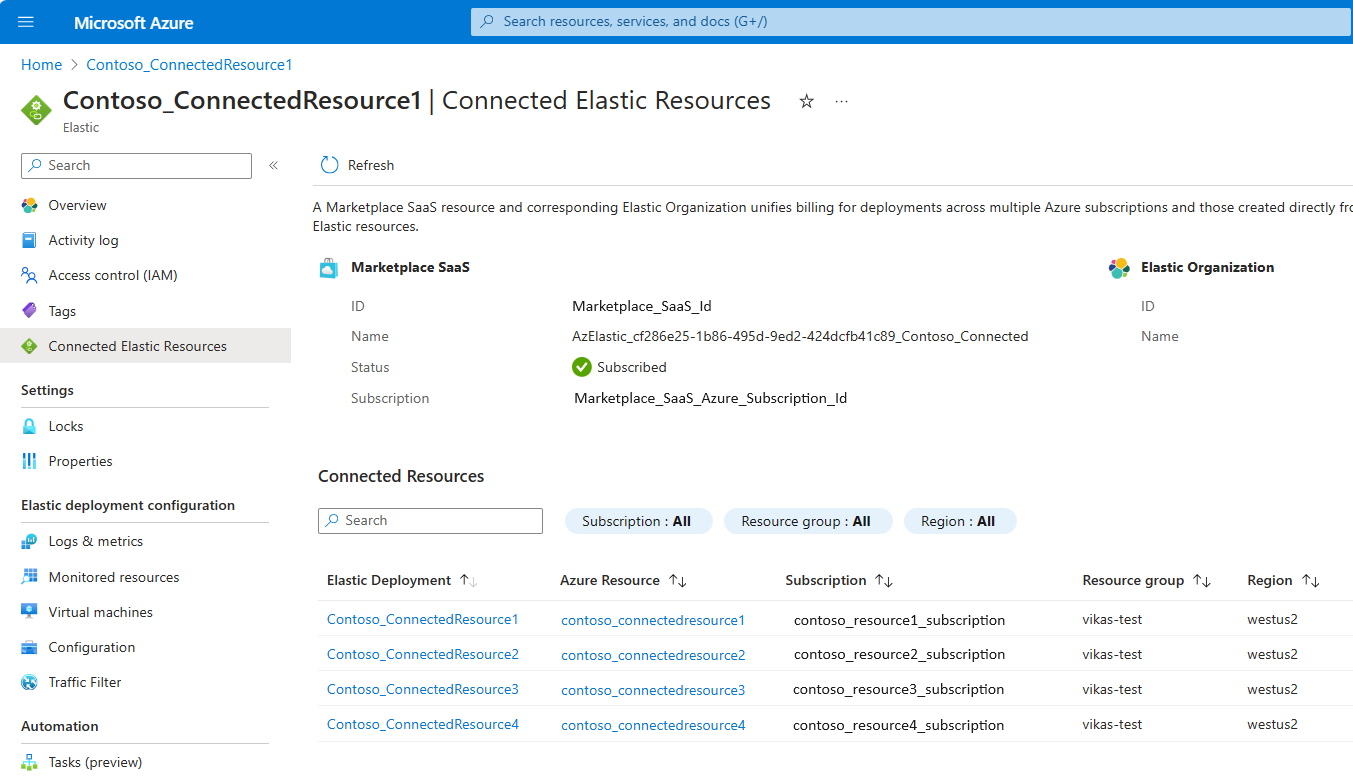
Screenshot showing Connected Elastic resources selected in the Resource menu.

You can easily manage the corresponding Elastic deployments or Azure resources using the links, provided you have owner or contributor rights to those deployments and resources.

Delete Elastic resource

When you no longer need your Elastic resource, delete the resource in the Azure portal.

 Important

Deleting an Elastic resource stops billing only for the corresponding Elastic deployment.

 Important

A single Azure marketplace SaaS unifies billing for multiple Elastic deployments. If you are looking to completely stop billing for the marketplace SaaS, you need to delete all linked Elastic deployments (created from Azure or Elastic portal). Deleting the Azure subscription or resource group corresponding to marketplace SaaS does not guarantee billing stop, as this does not clean up corresponding Elastic deployments.

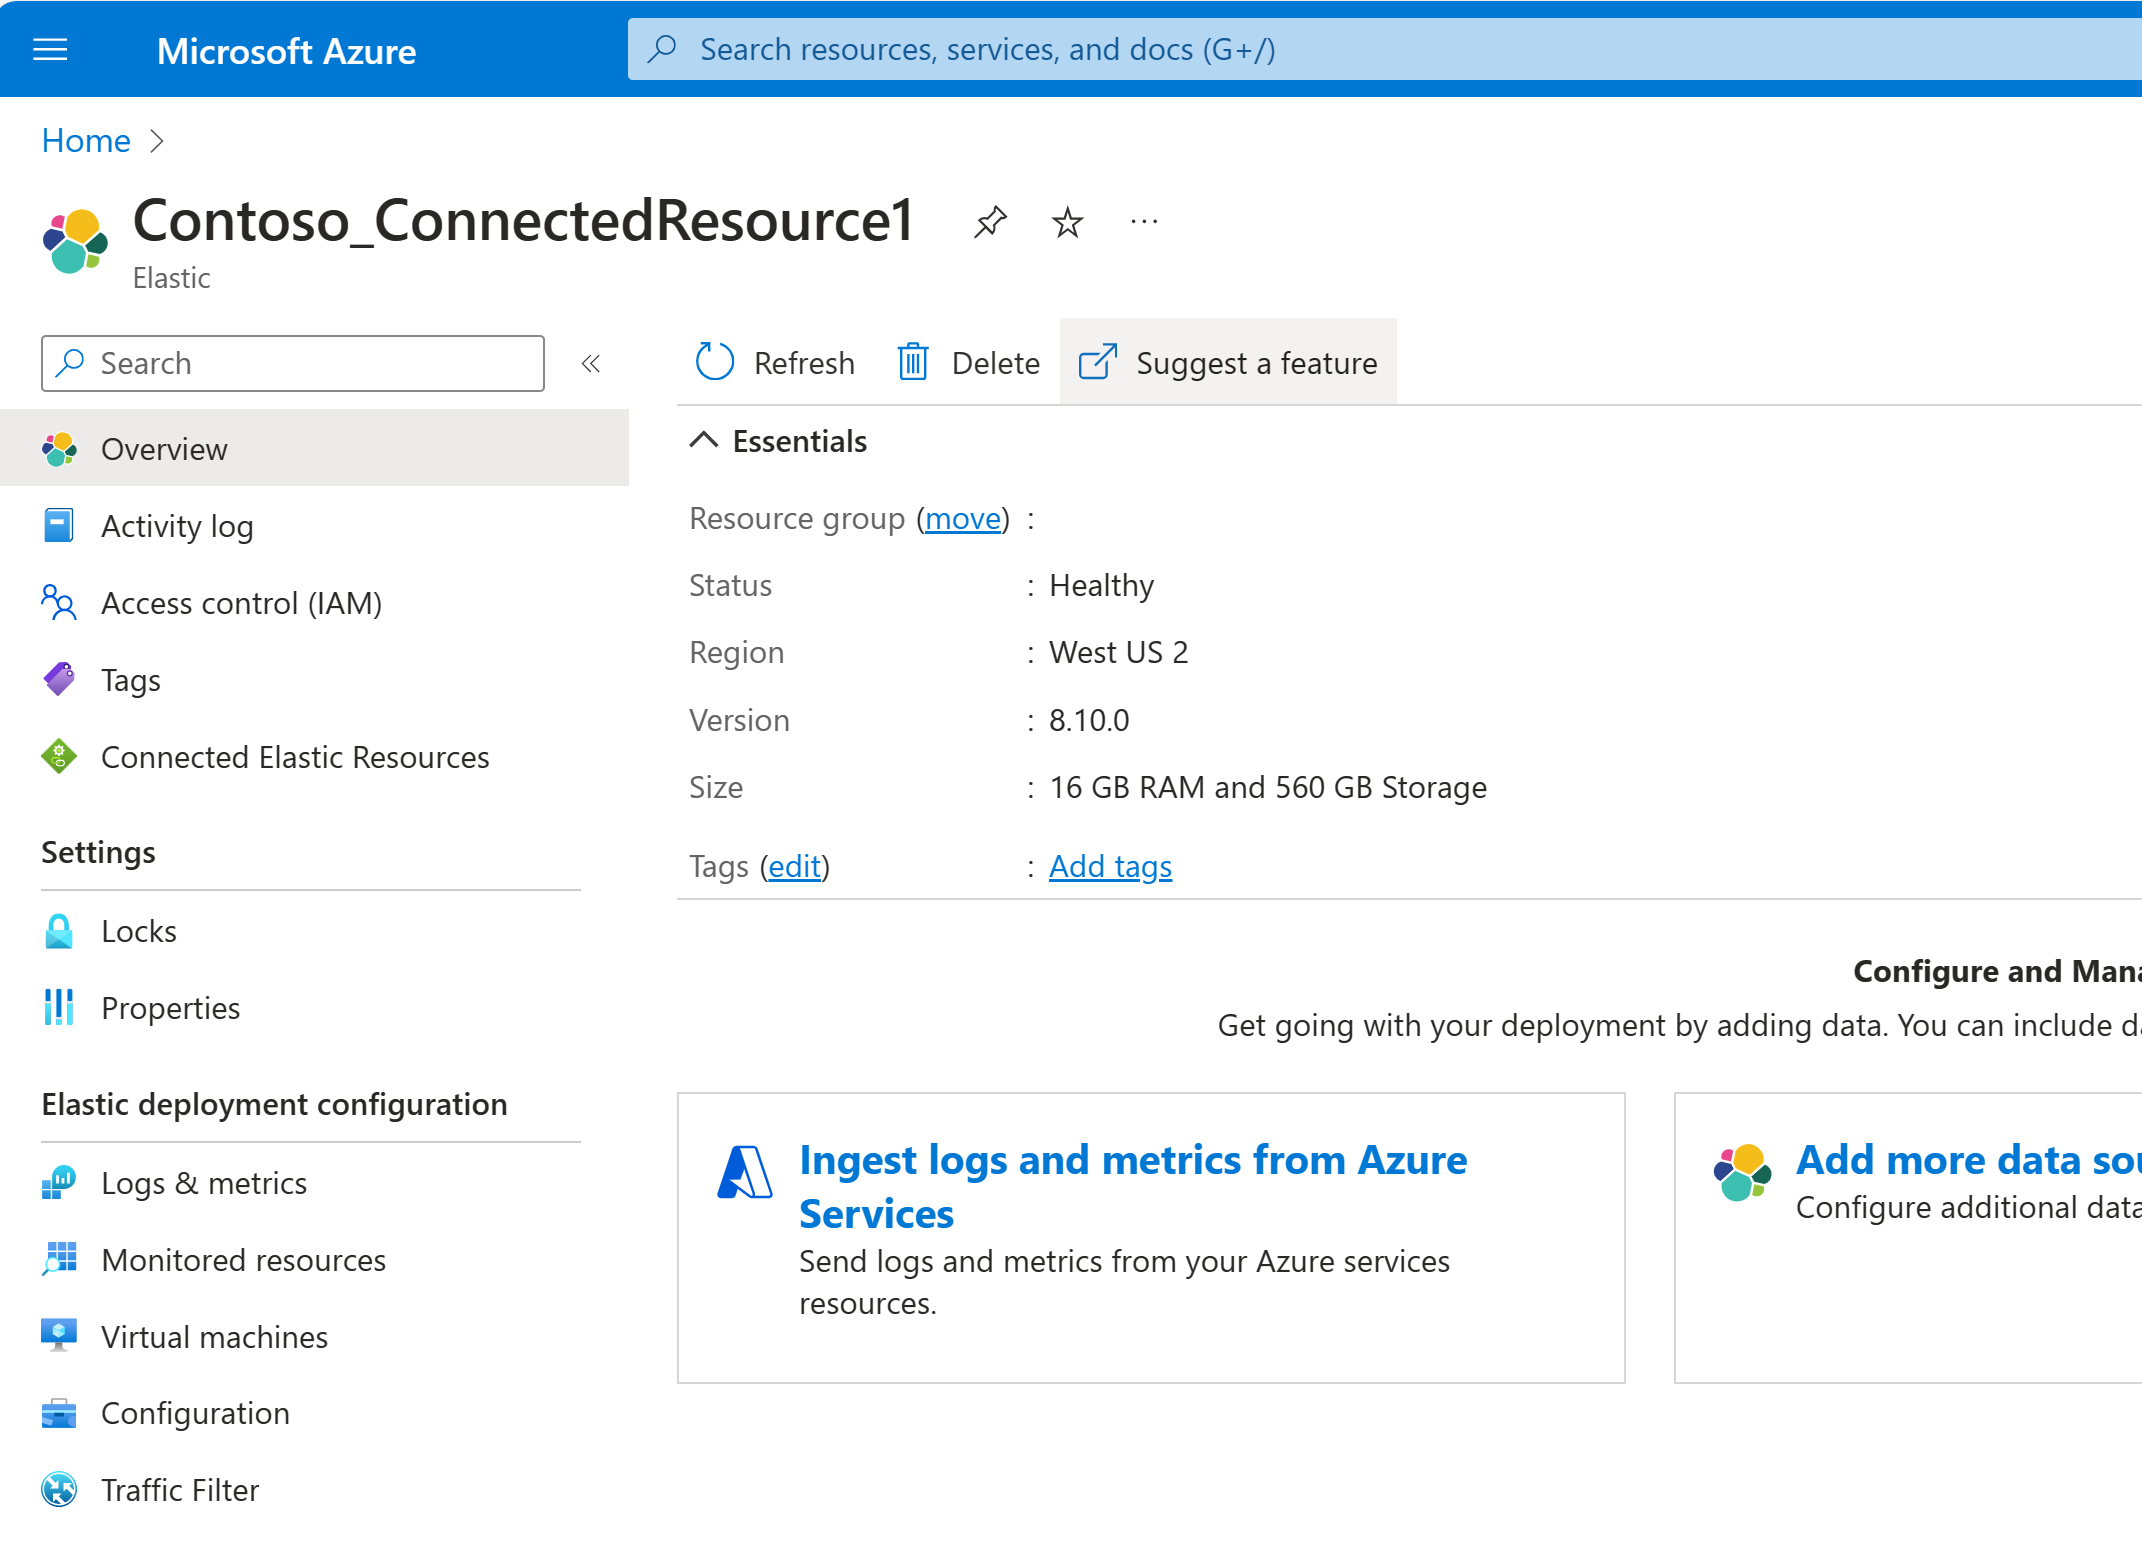
To delete the resource in Azure, select your Elastic resource. In Overview, select Delete. Confirm that you want to delete Elastic resource.
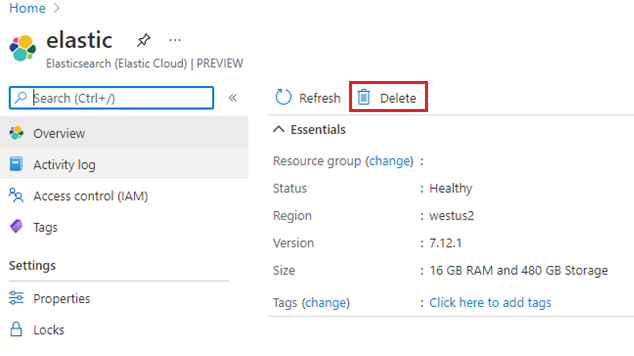
Screenshot of delete Elastic resource.

When the Elastic resource is deleted, logs are no longer sent to Elastic. All billing stops for Elastic through the Azure Marketplace.

Deploying Elastic Cloud


Deploying Elastic Cloud

One great starting point is the Azure Marketplace, where you can sign up using your existing Azure account with integrated billing. Just search for Elastic Cloud and then select the Elastic Cloud (Elasticsearch managed service).


The Azure Marketplace listing provides a great overview, as well as links to learn more.

Click Get it Now and then agree to the authentication request to continue. You will be redirected to the Azure portal, where you will need to click Set up + subscribe.

graphical user interface, text, application

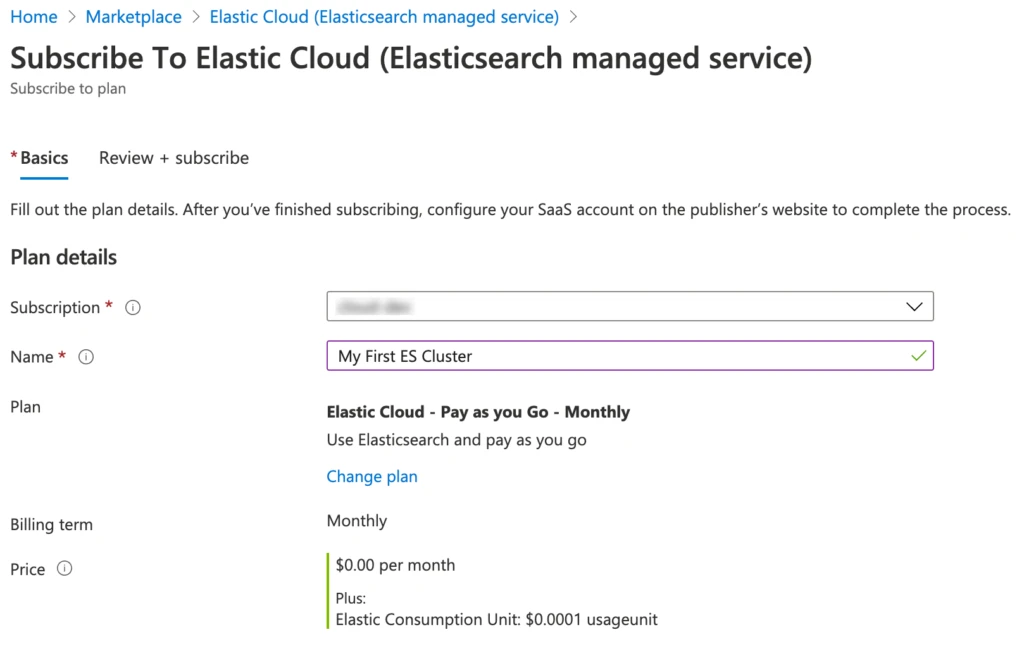
You will select the Azure subscription, provide a name, such as My First ES Cluster, and then review and click Subscribe.

graphical user interface, text, application

Once the SaaS configuration is complete, you will need to click Configure account now. This directs you to the elastic.co site, where you will need to create an account.

Once you have signed up, confirmed your account through an email notification, login, and click Create deployment.


Deployment choices

To get started, we recommend you pick one of the pre-configured solutions that best fits your needs. Let us start with the example of Elastic Observability.

With the Elastic Observability solution, users can combine logs, metrics, and application performance management (APM) under one unified visibility product, Kibana. This solution offers enhanced insight analysis. Ingesting and then aggregating logs and metrics to produce a relevant search experience is a fundamental tenet to the needs of operations, support, and executive leadership looking to make intelligent decisions.

Of course, this is just one of the four pre-configured solutions offered through this deployment process. The others include:

  • Enterprise Search: Search everything anywhere and break down silos. Elastic App Search, provides tools to design and deploy a powerful search experience for websites and applications. Elastic Workplace Search gives teams the power to instantly search through all their favorite content sources.
  • Elastic Security: Incorporates Elastic SIEM and Elastic Endpoint Security, where interacting with real-time data allows for actionable insights under a single holistic view. SIEM includes automated threat detection features and uses Elastic features, such as machine learning with prebuilt anomaly detection jobs to gain deep intelligence. Endpoint Security protects the endpoints with threat detection, including anti-malware.
  • Elastic Stack: Incorporates Elastic’s data visualization product Kibana, as well as its open source data search and analytics engine, Elasticsearch, which drives relevant search results at speed and scale.

Deployment settings

After choosing a relevant solution, you will confirm the cloud providerregion, and version.

Should you need to make a change simply click Expand to the right of the listings.

6_choose-provider-region-version

Elastic Stack versions

The latest version will always be selected, though it is a simple click or two to change. It is that simple after deployment as well, making it super simple to take advantage of newer features, as well as the latest security patches the day they are released, by performing a similar configuration change to the template. You should receive email notifications as new releases are made available.

The upgrades are designed to be automated and trouble-free while helping mitigate unplanned downtime. You can validate version upgrade changes by visiting the change reference guide.

To learn more about upgrading to newer versions of the Elastic Stack on our hosted service, see Upgrade Versions.

Complete deployment settings

Simply assign a unique name to the deployment, if you would like, and then click Create deployment. That’s it!

a close up of a logo

Launch Kibana

During the deployment creation process, you are provided the elastic user password to securely save. Take note of this, though if you do not remember your password, do not to worry. You can easily reset it at any time. Instructions are available by visiting the Reset the elastic user password page.

Click Open Kibana.

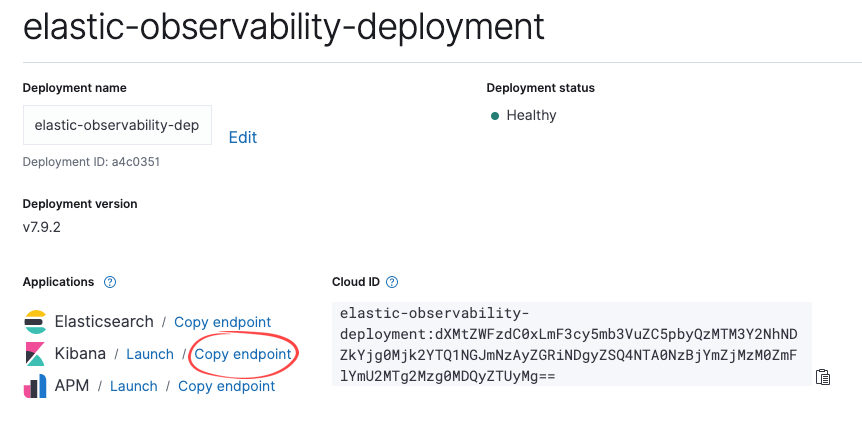
Launching Kibana from the Elastic Console will seamlessly log you on as the user who created the deployment. However, additional users will want to use the endpoint link, provided within the console.

graphical user interface, text, application, email

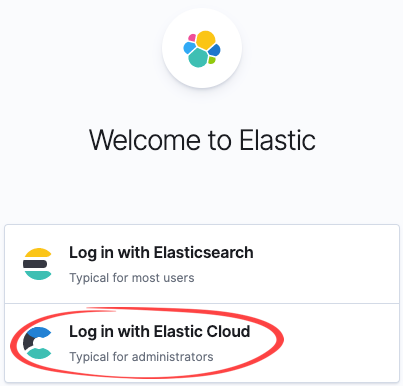
The end user will click Log in with Elasticsearch, which is what non-administrative users will use, such as a user who has permissions to run reports within Kibana.

graphical user interface, application

As the administrator, you can also utilize this link by choosing to Log in with Elastic Cloud, and then entering the same credentials you had while logging into the Elastic Console, when creating the deployment. This provides the most administrative privileges.

Ingesting sample data

Let’s look at real-world data in Kibana. Elastic provides the ability to add sample data. This is a wonderful way to get familiar with visualizing real-world data without spending too much extra time on configuring data ingestion, though that too is rather straightforward and will be covered in a subsequent blog. Check out the Getting started with Kibana video.

Once logged into Kibana, since it is the first time, you will be prompted to choose between “try our sample data” or “explore on my own.” If you are ready to visualize and navigate through the Kibana features, like Kibana Lens, which allows you to build amazingly rich visualizations by a simple drag-n-drop method, there is no quicker way than to load one of three types of sample data.


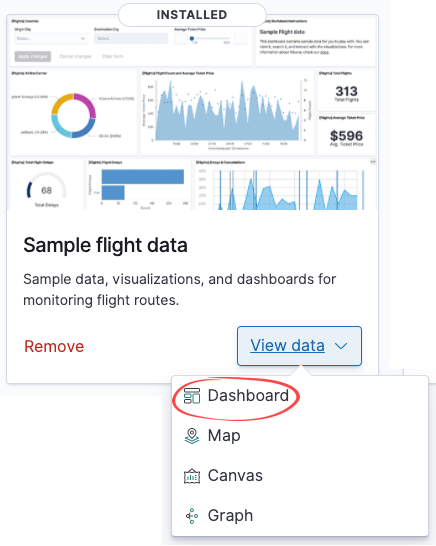
Whichever sample you choose, simply click Load data, wait for the data to be loaded, and then click View data and then Dashboard to see the power of Kibana firsthand.

graphical user interface, application

Customizable settings

Pre-configured solutions, along with deployment templates, can get you up and running without needing to worry about properly sizing the cluster, giving you the ability at any time to customize them. You can adjust capacity and performance, change the level of fault tolerance, add more features, and much more.

Troubleshooting Elastic Cloud (Elasticsearch) - An Azure Native ISV Service


Troubleshooting Elastic Cloud (Elasticsearch) - An Azure Native ISV Service

This document contains information about troubleshooting your solutions that use Elastic.

Unable to create an Elastic resource

Only users who have Owner or Contributor access on the Azure subscription can set up the Elastic resource. Confirm that you have the appropriate access.

Logs not being emitted to Elastic

  • Only resources listed in Azure Monitor resource log categories emit logs to Elastic. To verify whether the resource is emitting logs to Elastic:

    1. Navigate to Azure diagnostic setting for the resource.
    2. Verify that there's a diagnostic setting option available.

    Screenshot of verify diagnostic setting.

  • Resource doesn't support sending logs. Only resource types with monitoring log categories can be configured to send logs. For more information, see supported categories.

  • Limit of five diagnostic settings reached. Each Azure resource can have a maximum of five diagnostic settings. For more information, see diagnostic settings

  • Export of Metrics data isn't supported currently by the partner solutions under Azure Monitor diagnostic settings.

Diagnostic settings are active even after disabling the Elastic resource or applying necessary tag rules

If logs are being emitted and diagnostic settings remain active on monitored resources even after the Elastic resource is disabled or tag rules have been modified to exclude certain resources, it's likely that there's a delete lock applied to the resource(s) or the resource group containing the resource. This lock prevents the cleanup of the diagnostic settings, and hence, logs continue to be forwarded for those resources. To resolve this, remove the delete lock from the resource or the resource group. If the lock is removed after the Elastic resource is deleted, the diagnostic settings have to be cleaned up manually to stop log forwarding.

Marketplace Purchase errors

  • The Microsoft.SaaS RP is not registered on the Azure subscription.

  • Plan cannot be purchased on a free subscription, please upgrade your account.

  • Purchase has failed because we couldn't find a valid payment method associated with your Azure subscription.

  • The Publisher does not make available Offer, Plan in your Subscription/Azure account’s region.

    • The offer or the specific plan isn't available to the billing account market that is connected to the Azure Subscription.
  • Enrollment for Azure Marketplace is set to Free/BYOL SKUs only, purchase for Azure product is not allowed. Please contact your enrollment administrator to change EA settings.

  • Marketplace is not enabled for the Azure subscription.

  • Plan by publisher is not available to you for purchase due to private marketplace settings made by your tenant’s IT administrator.

    • Customer uses private marketplace to limit the access of its organization to specific offers and plans. The specific offer or the plan weren't set up to be available in the tenant's private marketplace. Contact your tenant’s IT administrator.
  • The EA subscription doesn't allow Marketplace purchases.

    • Use a different subscription or check if your EA subscription is enabled for Marketplace purchase. For more information, see Enable Marketplace purchases.

Suggest a feature

To suggest a new feature for the Elastic integration with Azure, select the Suggest a feature link at the top of the resource overview page.

Screenshot of suggesting a feature for the Elastic integration with Azure.

This link takes you to the Developer community forum where you can suggest a new feature. You can also view, upvote, or comment on feature suggestions from other customers.

Get started with Elastic


Get started with Elastic

Prerequisites

  • Subscription owner - The Elastic integration with Azure can only be created by users who have Owner or Contributor permissions on the Azure subscription. Confirm that you have the appropriate access before starting the setup.
  • Single sign-on app - The ability to automatically navigate between the Azure portal and Elastic Cloud is enabled via single sign-on (SSO). This option is automatically enabled and turned on for all Azure users.

Find offer

Use the Azure portal to find the Elastic application.

  1. In a web browser, go to the Azure portal and sign in.

  2. If you've visited the Marketplace in a recent session, select the icon from the available options. Otherwise, search for Marketplace.

    Image of marketplace icon.

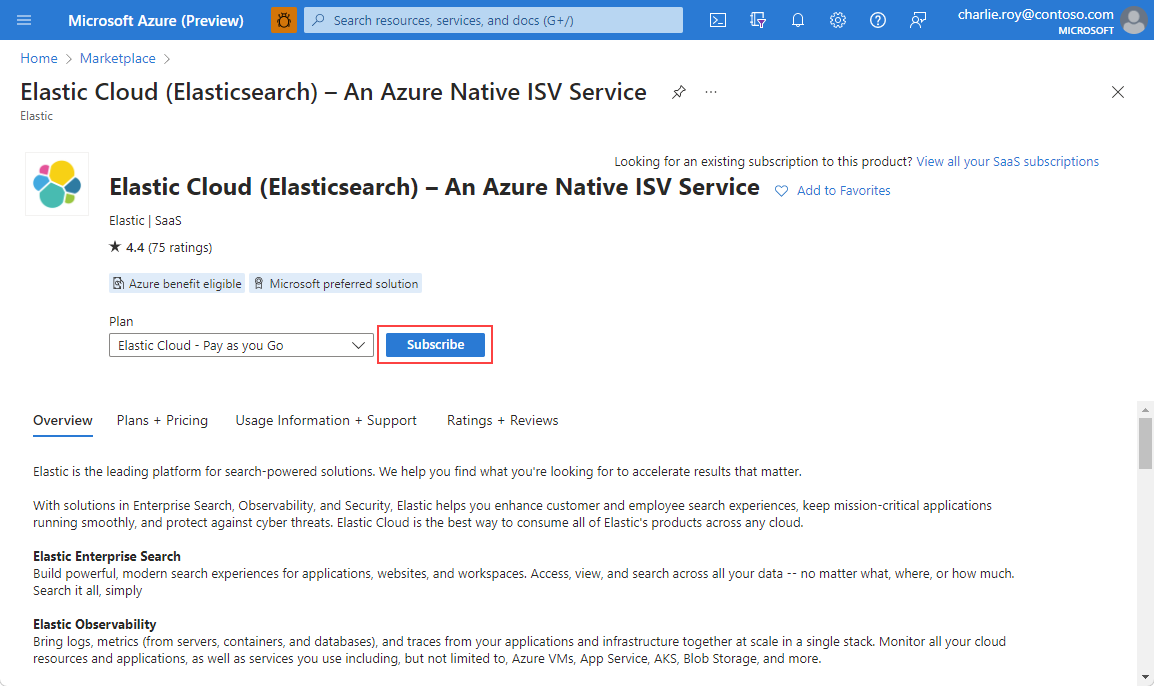
  3. Search for Elastic and select Elastic Cloud (Elasticsearch) - An Azure Native ISV Service from the available offerings.

  4. Select Set up + subscribe.

    select offer.

Create resource

After you've selected the offer for Elastic, you're ready to set up the application.

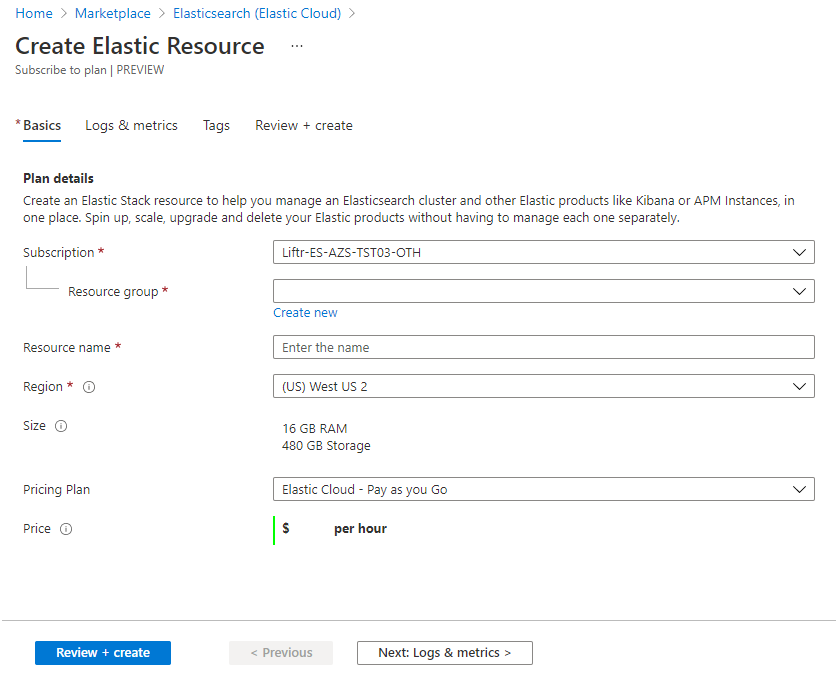
  1. On the Create Elastic Resource basics page, provide the following values.

    Form to set up Elastic resource.

    PropertyDescription
    SubscriptionFrom the drop-down, select an Azure subscription where you have owner access.
    Resource groupSpecify whether you want to create a new resource group or use an existing resource group. A resource group is a container that holds related resources for an Azure solution. For more information, see Azure Resource Group overview.
    Elastic account nameProvide the name for the Elastic account you want to create
    RegionSelect the region you want to deploy to.
    Pricing PlanPay as you go.
    PriceSpecified based on the selected Elastic plan.

    When you've finished, select Next: Logs and Metrics.

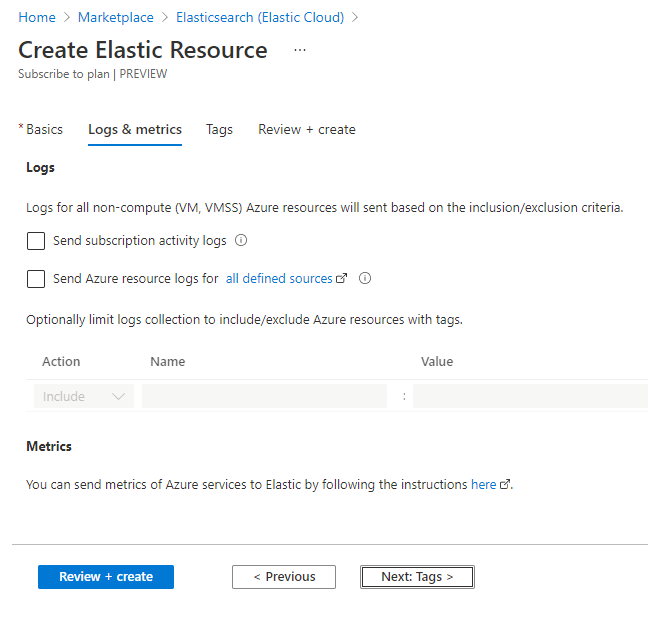
  2. On Logs & metrics, specify which logs to send to Elastic.

    Select logs to send.

    There are two types of logs that can be emitted from Azure to Elastic.

    Subscription logs provide insights into the operations on each Azure resource in the subscription from the management plane. The logs also provide updates on Service Health events. Use the activity log to determine what, who, and when for any write operations (PUT, POST, DELETE) on the resources in your subscription. There's a single activity log for each Azure subscription.

    Azure resource logs provide insights into operations that happen within the data plane. For example, getting a secret from a key vault or making a request to a database are data plane activities. The content of resource logs varies by the Azure service and resource type. The types of Azure resource logs are listed in Azure Monitor Resource Log categories.

    To filter the Azure resources that send logs to Elastic, use resource tags. The tag rules for sending logs are:

    • By default, logs are collected for all resources.
    • Resources with Include tags send logs to Elastic.
    • Resources with Exclude tags don't send logs to Elastic.
    • If there's a conflict between inclusion and exclusion rules, exclusion takes priority.

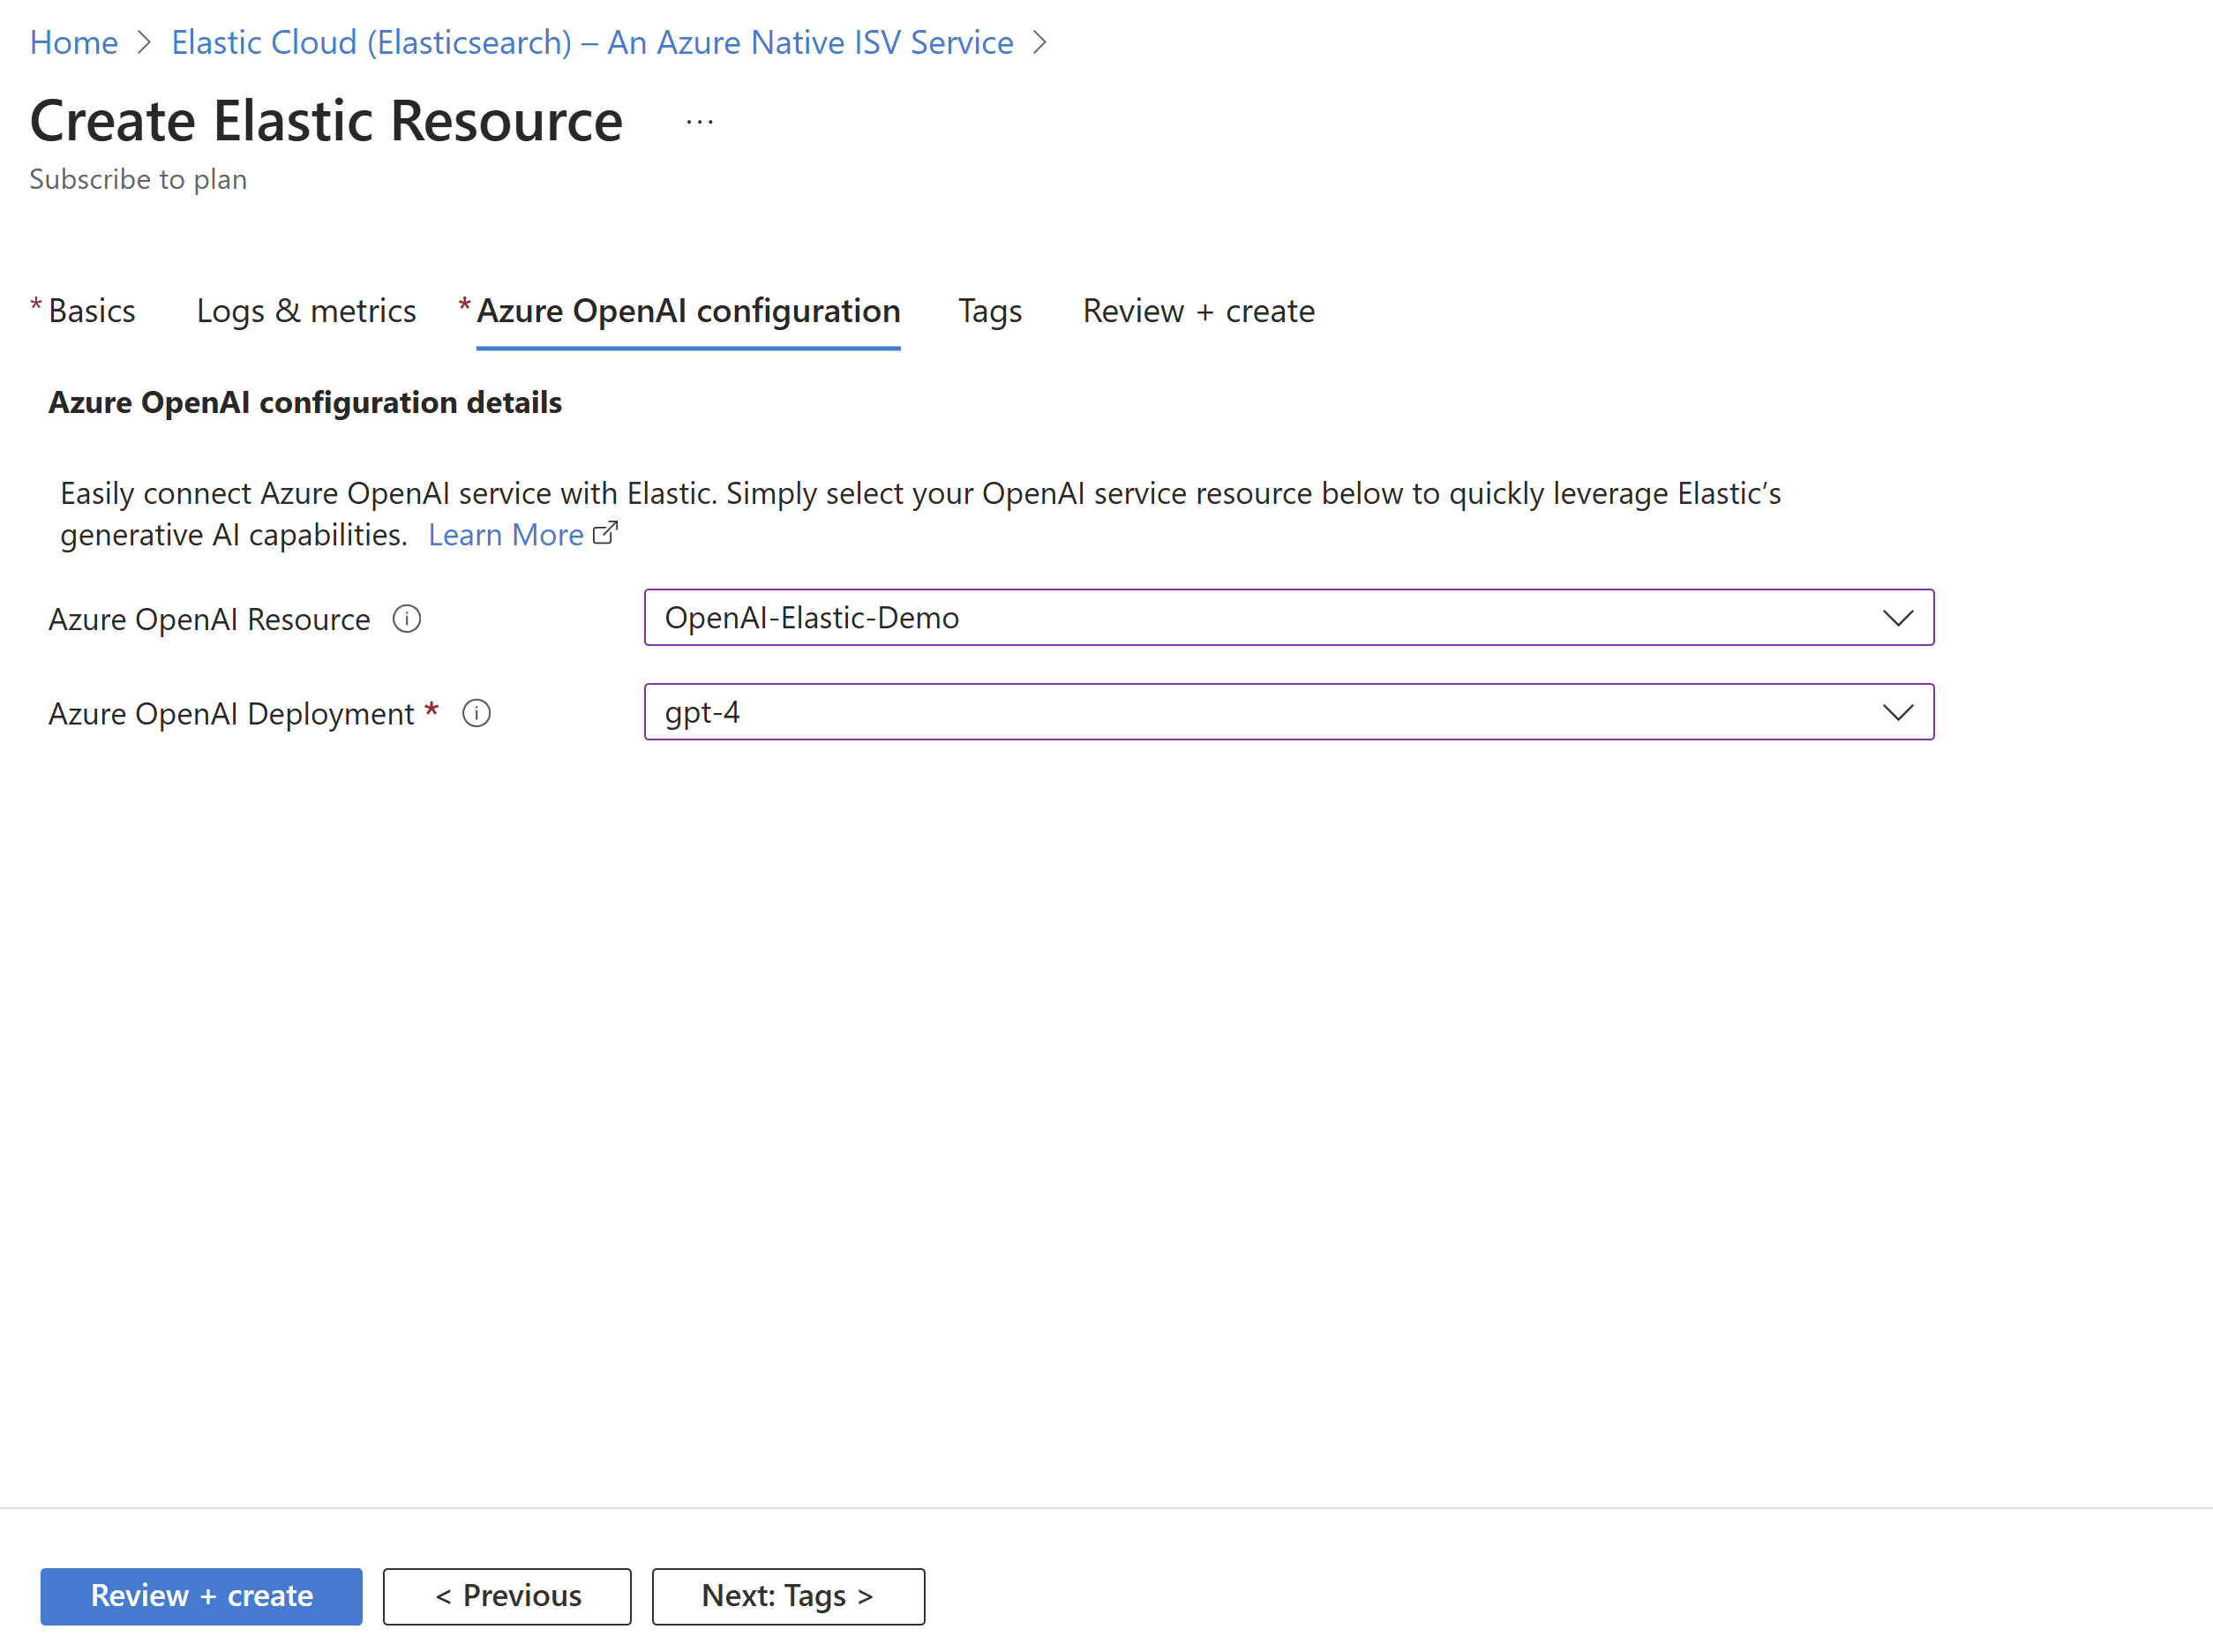
    Select Next: Azure OpenAI configuration to create and configure Azure OpenAI connector that can be used within Elastic's AI Assistant.

  3. On Azure OpenAI configuration, specify the Azure OpenAI resource and the deployment that would be required to configure the connector. The details of the deployment (url, API keys etc.) are passed on to Elastic to prepare the connector to be used with Elastic's AI Assistant.

    Screenshot of how to configure Azure OpenAI Connector.

     Note

    Only deployments of text/chat completion models (like gpt4) are supported currently. Learn more about Elastic Connectors here.

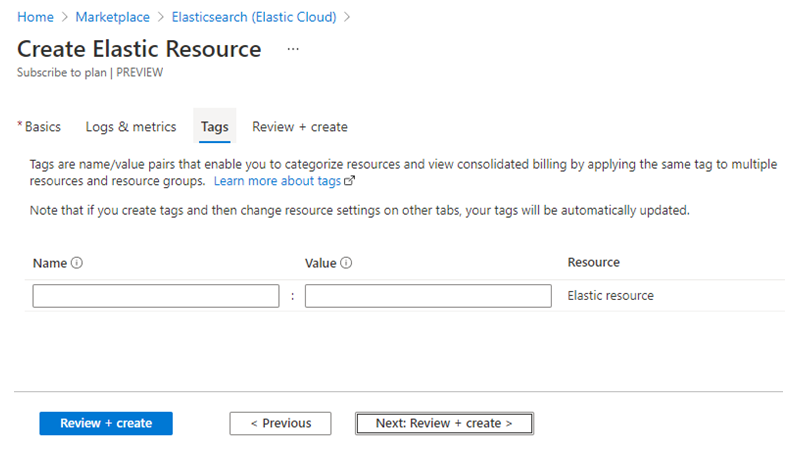
    Select Next: Tags to set up tags for the new Elastic resource.

  4. In Tags, add custom tags for the new Elastic resource. Each tag consists of a name and value. When you've finished adding tags, select Next: Review+Create to navigate to the final step for resource creation.

    Screenshot of add tags to Elastic resource.

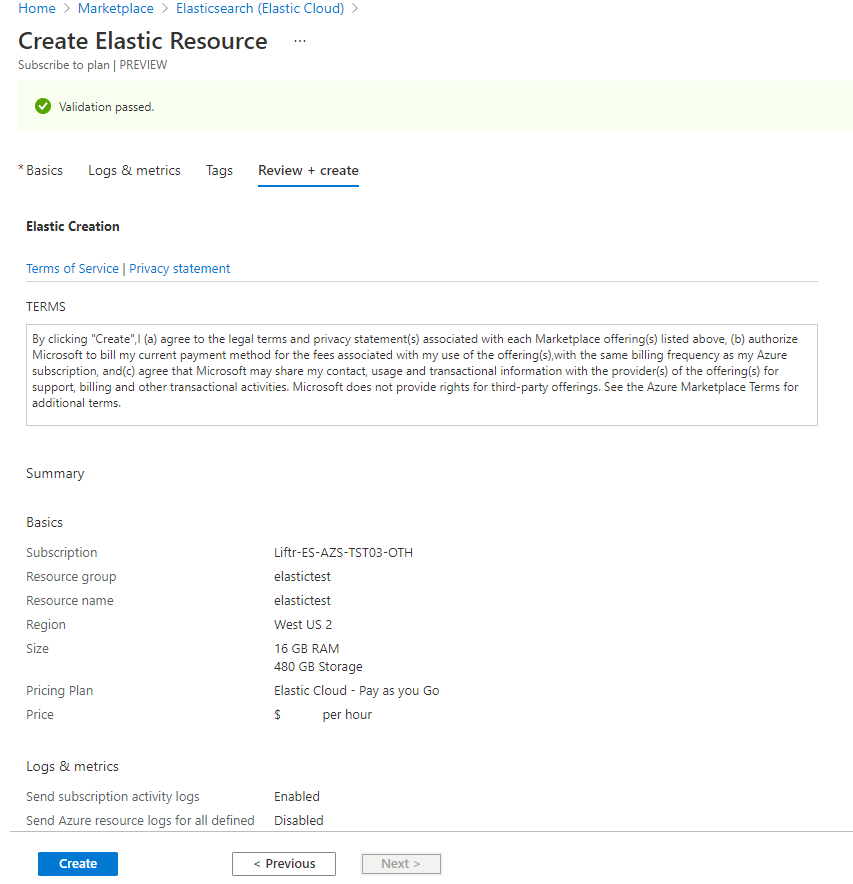
  5. On Review + create, your configuration is validated. You can review the selections you made in the earlier forms. You can also review the terms for this offering.

    Review and validation selections

    After validation has succeeded and you've reviewed the terms, select Create.

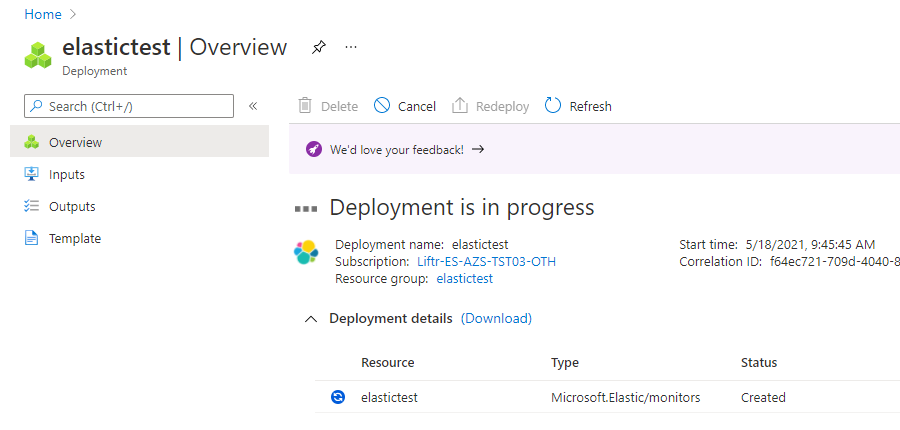
  6. Azure starts the deployment.

    Deployment status

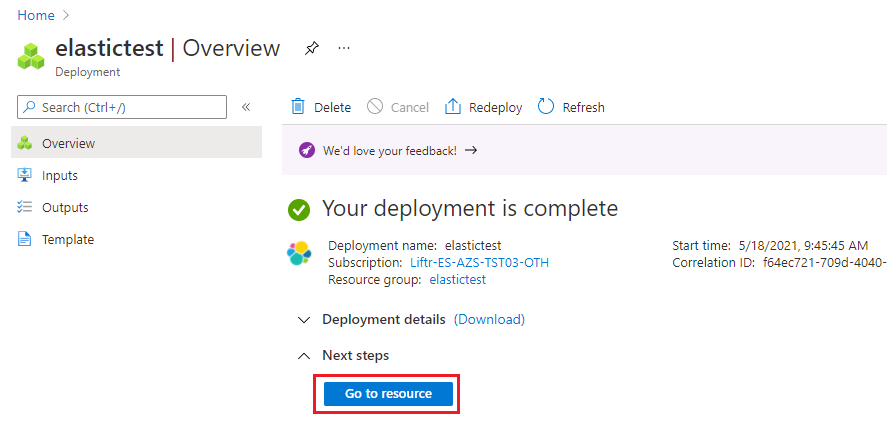
  7. After the deployment is finished, select Go to resource to view the deployed resource.

    Screenshot of view status of deployment.