Deploying Elastic Cloud
One great starting point is the Azure Marketplace, where you can sign up using your existing Azure account with integrated billing. Just search for Elastic Cloud and then select the Elastic Cloud (Elasticsearch managed service).
The Azure Marketplace listing provides a great overview, as well as links to learn more.
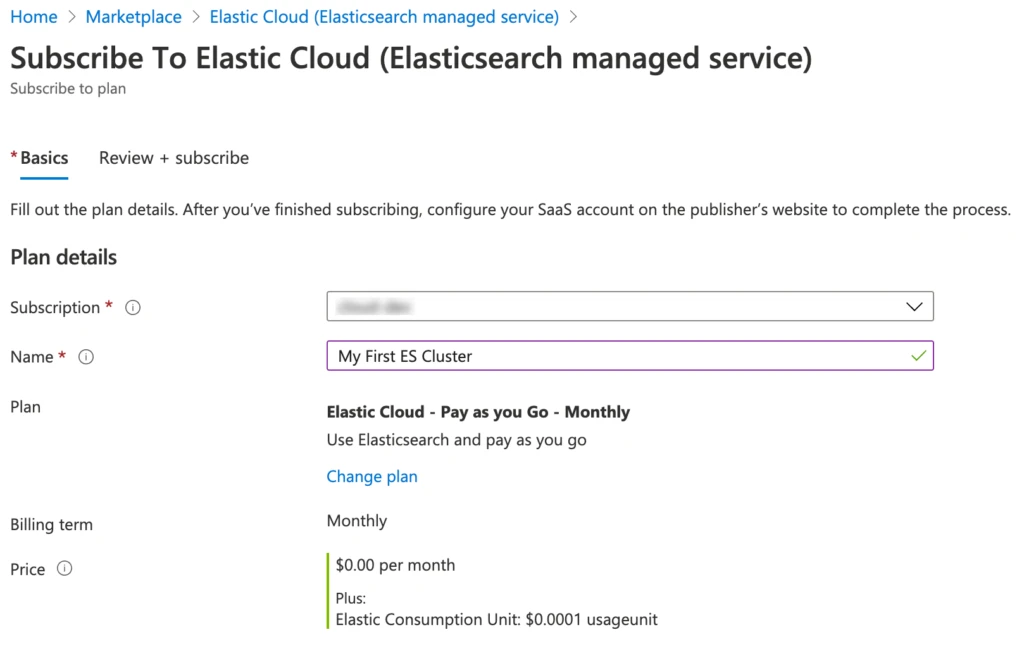
Click Get it Now and then agree to the authentication request to continue. You will be redirected to the Azure portal, where you will need to click Set up + subscribe.

You will select the Azure subscription, provide a name, such as My First ES Cluster, and then review and click Subscribe.

Once the SaaS configuration is complete, you will need to click Configure account now. This directs you to the elastic.co site, where you will need to create an account.
Once you have signed up, confirmed your account through an email notification, login, and click Create deployment.
Deployment choices
To get started, we recommend you pick one of the pre-configured solutions that best fits your needs. Let us start with the example of Elastic Observability.
With the Elastic Observability solution, users can combine logs, metrics, and application performance management (APM) under one unified visibility product, Kibana. This solution offers enhanced insight analysis. Ingesting and then aggregating logs and metrics to produce a relevant search experience is a fundamental tenet to the needs of operations, support, and executive leadership looking to make intelligent decisions.
Of course, this is just one of the four pre-configured solutions offered through this deployment process. The others include:
- Enterprise Search: Search everything anywhere and break down silos. Elastic App Search, provides tools to design and deploy a powerful search experience for websites and applications. Elastic Workplace Search gives teams the power to instantly search through all their favorite content sources.
- Elastic Security: Incorporates Elastic SIEM and Elastic Endpoint Security, where interacting with real-time data allows for actionable insights under a single holistic view. SIEM includes automated threat detection features and uses Elastic features, such as machine learning with prebuilt anomaly detection jobs to gain deep intelligence. Endpoint Security protects the endpoints with threat detection, including anti-malware.
- Elastic Stack: Incorporates Elastic’s data visualization product Kibana, as well as its open source data search and analytics engine, Elasticsearch, which drives relevant search results at speed and scale.
Deployment settings
After choosing a relevant solution, you will confirm the cloud provider, region, and version.
Should you need to make a change simply click Expand to the right of the listings.

Elastic Stack versions
The latest version will always be selected, though it is a simple click or two to change. It is that simple after deployment as well, making it super simple to take advantage of newer features, as well as the latest security patches the day they are released, by performing a similar configuration change to the template. You should receive email notifications as new releases are made available.
The upgrades are designed to be automated and trouble-free while helping mitigate unplanned downtime. You can validate version upgrade changes by visiting the change reference guide.
To learn more about upgrading to newer versions of the Elastic Stack on our hosted service, see Upgrade Versions.
Complete deployment settings
Simply assign a unique name to the deployment, if you would like, and then click Create deployment. That’s it!

Launch Kibana
During the deployment creation process, you are provided the elastic user password to securely save. Take note of this, though if you do not remember your password, do not to worry. You can easily reset it at any time. Instructions are available by visiting the Reset the elastic user password page.
Click Open Kibana.
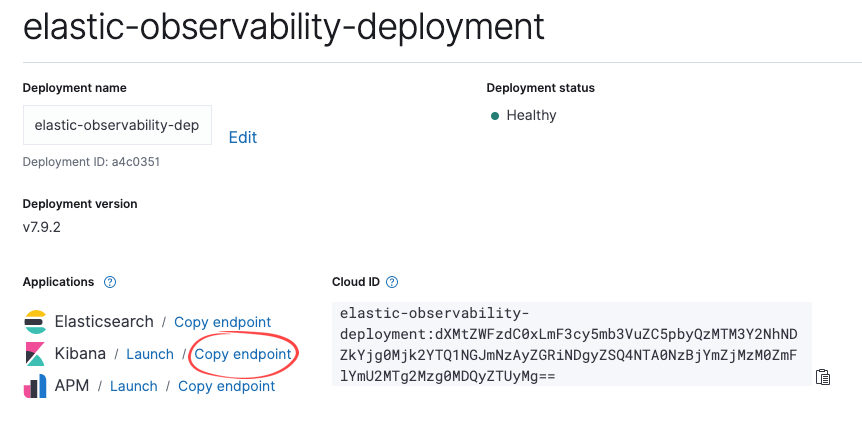
Launching Kibana from the Elastic Console will seamlessly log you on as the user who created the deployment. However, additional users will want to use the endpoint link, provided within the console.

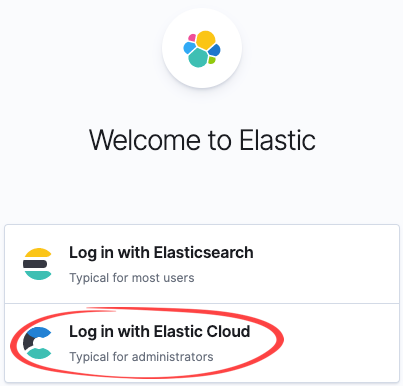
The end user will click Log in with Elasticsearch, which is what non-administrative users will use, such as a user who has permissions to run reports within Kibana.

As the administrator, you can also utilize this link by choosing to Log in with Elastic Cloud, and then entering the same credentials you had while logging into the Elastic Console, when creating the deployment. This provides the most administrative privileges.
Ingesting sample data
Let’s look at real-world data in Kibana. Elastic provides the ability to add sample data. This is a wonderful way to get familiar with visualizing real-world data without spending too much extra time on configuring data ingestion, though that too is rather straightforward and will be covered in a subsequent blog. Check out the Getting started with Kibana video.
Once logged into Kibana, since it is the first time, you will be prompted to choose between “try our sample data” or “explore on my own.” If you are ready to visualize and navigate through the Kibana features, like Kibana Lens, which allows you to build amazingly rich visualizations by a simple drag-n-drop method, there is no quicker way than to load one of three types of sample data.
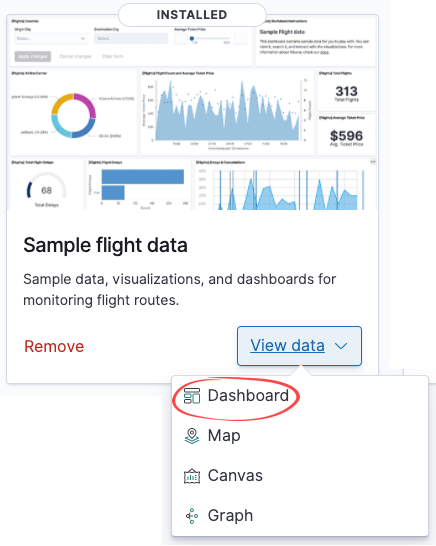
Whichever sample you choose, simply click Load data, wait for the data to be loaded, and then click View data and then Dashboard to see the power of Kibana firsthand.

Customizable settings
Pre-configured solutions, along with deployment templates, can get you up and running without needing to worry about properly sizing the cluster, giving you the ability at any time to customize them. You can adjust capacity and performance, change the level of fault tolerance, add more features, and much more.

No comments:
Post a Comment