Friday 12 July 2024

Automatic scaling in Azure App Service


Automatic scaling in Azure App Service

Automatic scaling is a new scale-out option that automatically handles scaling decisions for your web apps and App Service Plans. It's different from the pre-existing Azure autoscale, which lets you define scaling rules based on schedules and resources. With automatic scaling, you can adjust scaling settings to improve your app's performance and avoid cold start issues. The platform prewarms instances to act as a buffer when scaling out, ensuring smooth performance transitions. You're charged per second for every instance, including prewarmed instances.

A comparison of scale-out and scale in options available on App Service:

How automatic scaling works

You enable automatic scaling for an App Service Plan and configure a range of instances for each of the web apps. As your web app starts receiving HTTP traffic, App Service monitors the load and adds instances. Resources may be shared when multiple web apps within an App Service Plan are required to scale-out simultaneously.

Here are a few scenarios where you should scale-out automatically:

  • You don't want to set up autoscale rules based on resource metrics.
  • You want your web apps within the same App Service Plan to scale differently and independently of each other.
  • Your web app is connected to a databases or legacy system, which may not scale as fast as the web app. Scaling automatically allows you to set the maximum number of instances your App Service Plan can scale to. This setting helps the web app to not overwhelm the backend.

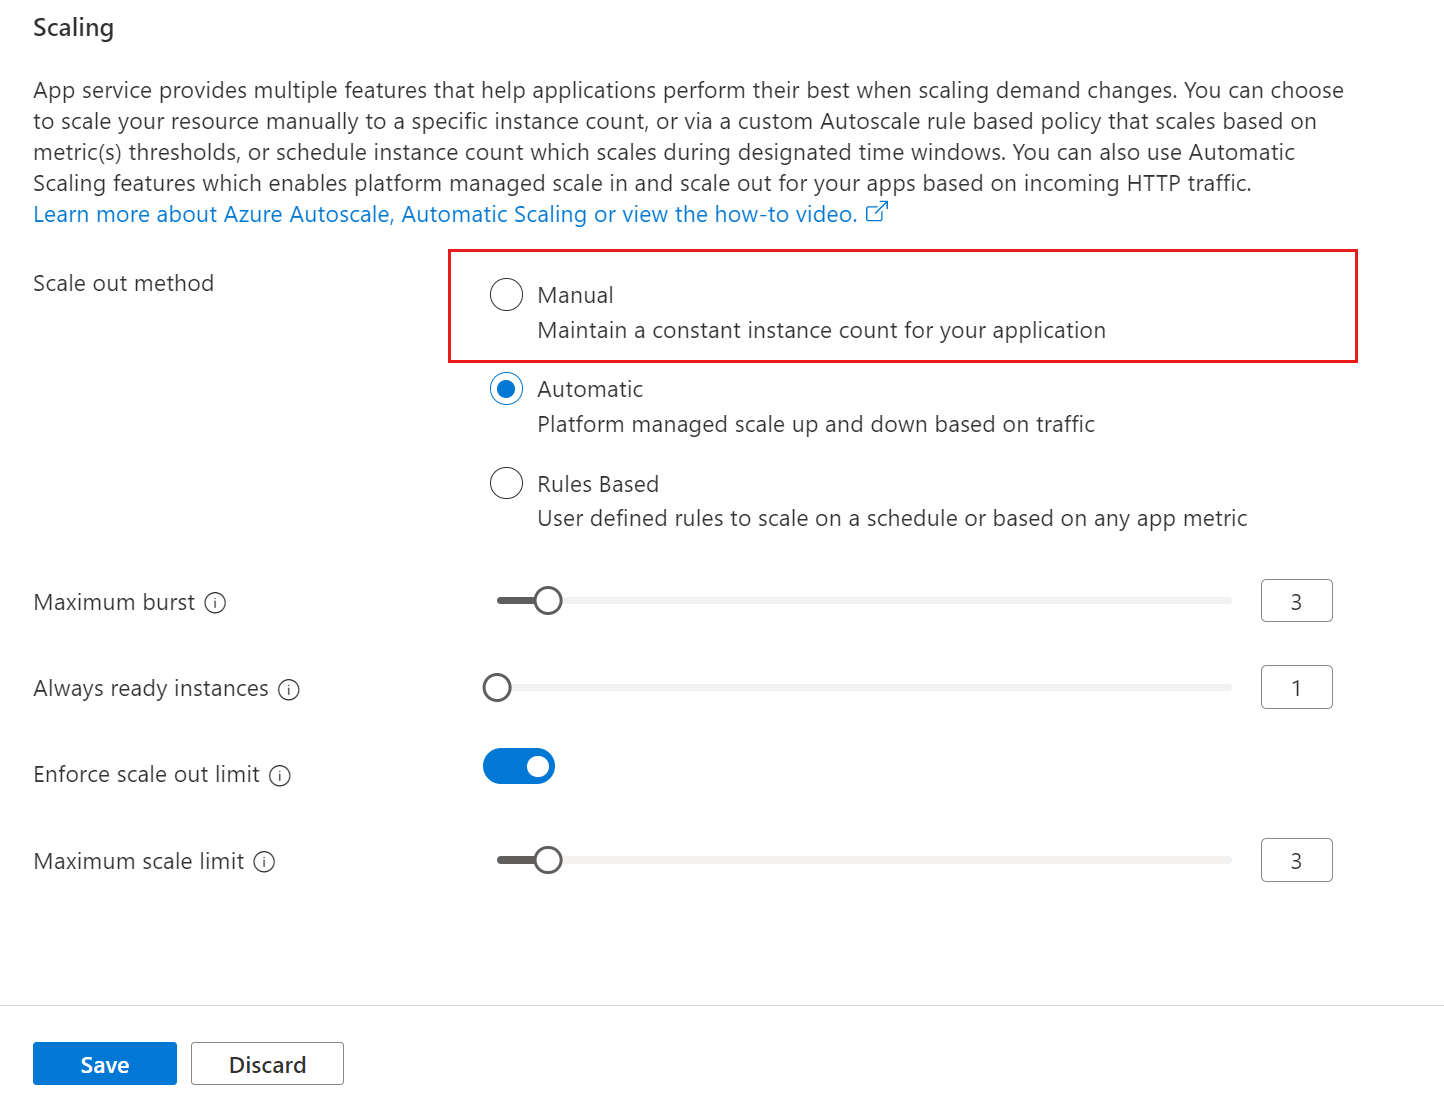
Enable automatic scaling

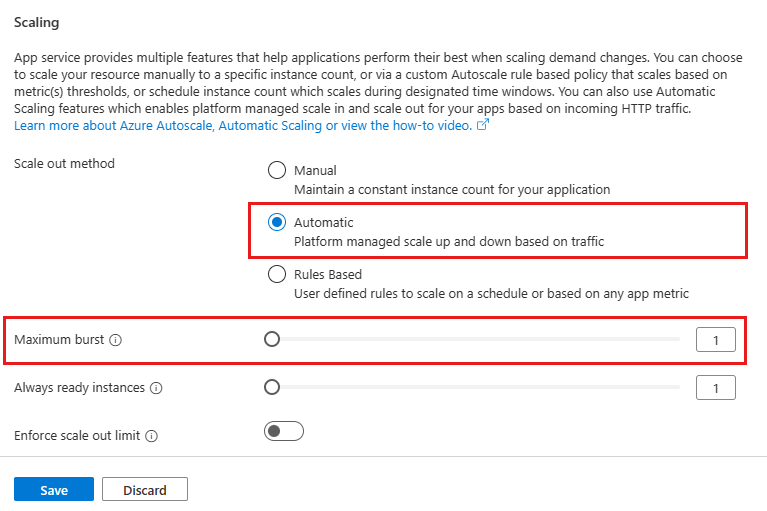
Maximum burst is the highest number of instances that your App Service Plan can increase to based on incoming HTTP requests. For Premium v2 & v3 plans, you can set a maximum burst of up to 30 instances. The maximum burst must be equal to or greater than the number of workers specified for the App Service Plan.

To enable automatic scaling, navigate to the web app's left menu and select scale-out (App Service Plan). Select Automatic, update the Maximum burst value, and select the Save button.

Automatic scaling in Azure portal

Set minimum number of web app instances

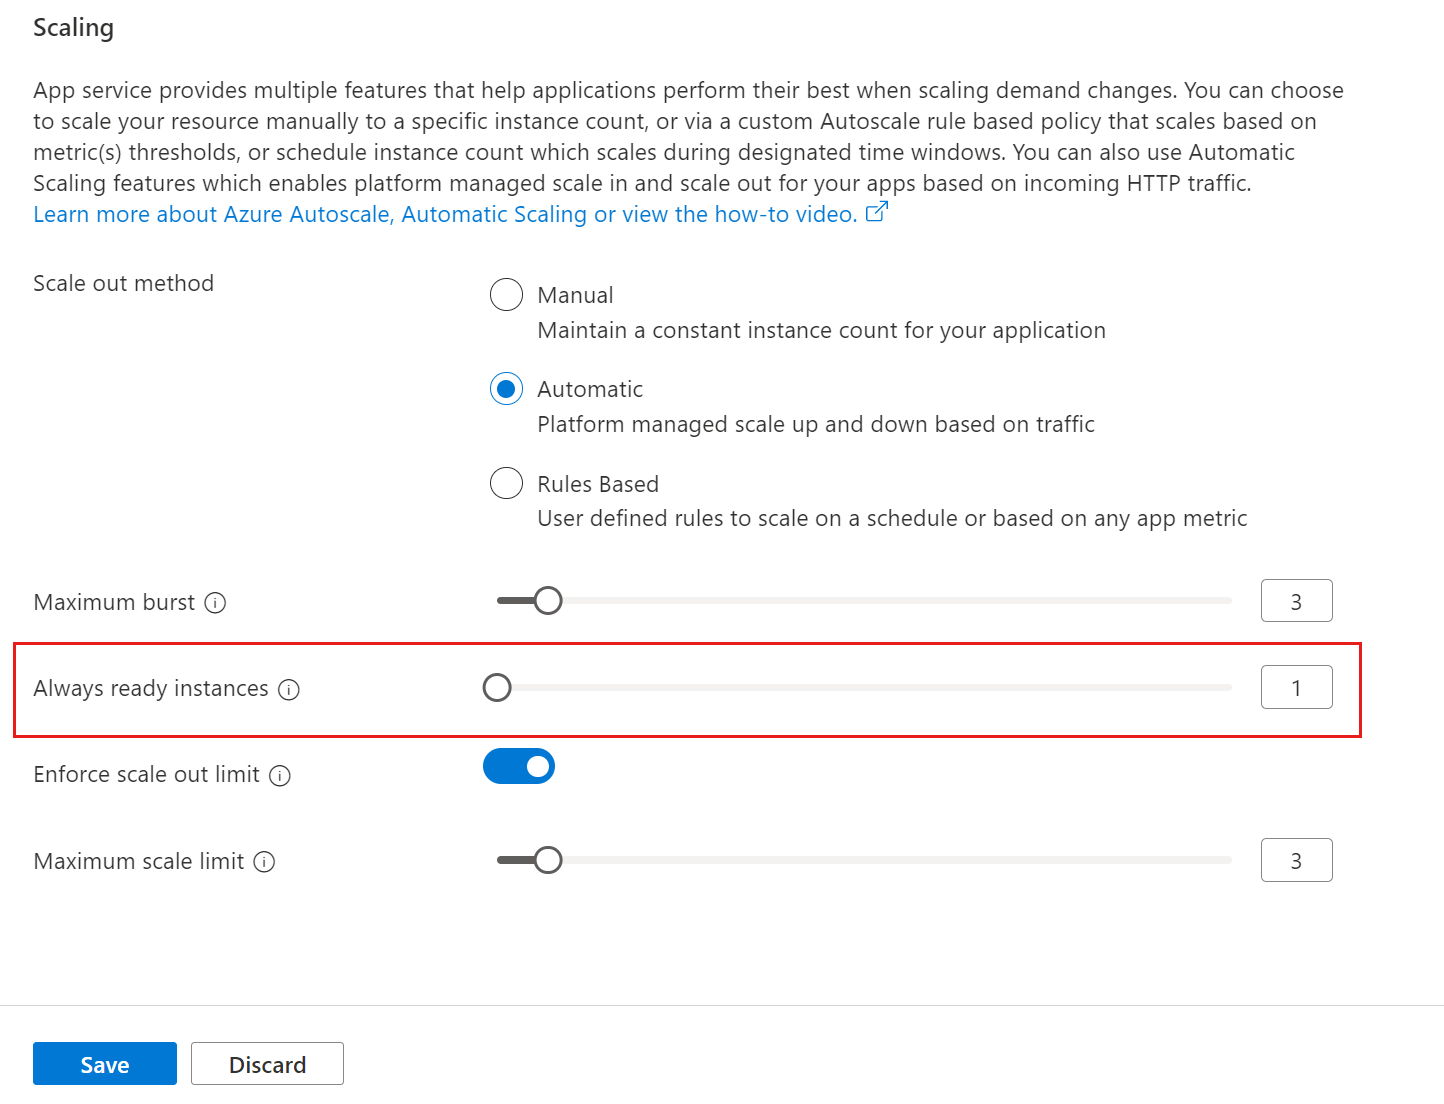
Always ready instances is an app-level setting to specify the minimum number of instances. If load exceeds what the always ready instances can handle, additional instances are added (up to the specified maximum burst for the App Service Plan).

To set the minimum number of web app instances, navigate to the web app's left menu and select scale-out (App Service Plan). Update the Always ready instances value, and select the Save button.

Screenshot of always ready instances

Set maximum number of web app instances

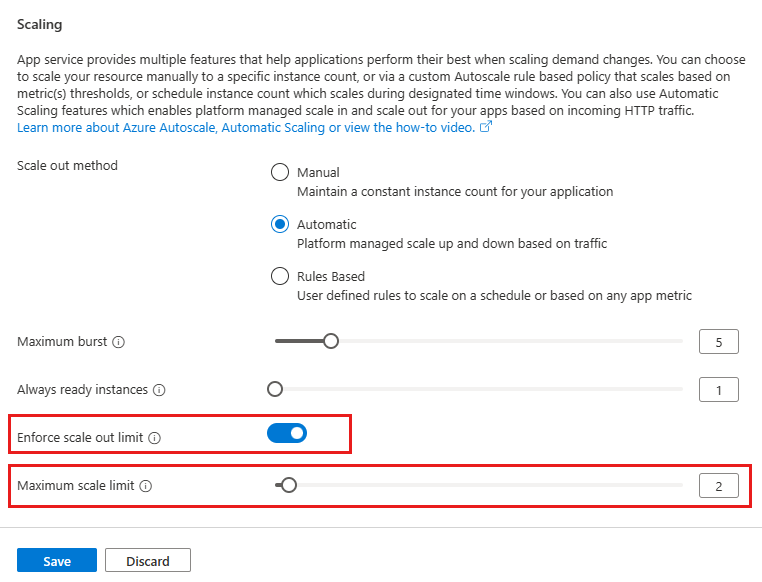
The maximum scale limit sets the maximum number of instances a web app can scale to. The maximum scale limit helps when a downstream component like a database has limited throughput. The per-app maximum can be between 1 and the maximum burst.

To set the maximum number of web app instances, navigate to the web app's left menu and select scale-out (App Service Plan). Select Enforce scale-out limit, update the Maximum scale limit, and select the Save button.

Screenshot of maximum scale limit

Update prewarmed instances

The prewarmed instance setting provides warmed instances as a buffer during HTTP scale and activation events. Prewarmed instances continue to buffer until the maximum scale-out limit is reached. The default prewarmed instance count is 1 and, for most scenarios, this value should remain as 1.

You can't change the prewarmed instance setting in the portal, you must instead use the Azure CLI.

Disable automatic scaling

To disable automatic scaling, navigate to the web app's left menu and select scale-out (App Service Plan). Select Manual, and select the Save button.

Screenshot of manual scaling

Get started with autoscale in Azure


Get started with autoscale in Azure

Autoscale allows you to automatically scale your applications or resources based on demand. Use Autoscale to provision enough resources to support the demand on your application without over provisioning and incurring unnecessary costs.

This article describes how to configure the autoscale settings for your resources in the Azure portal.

Azure autoscale supports many resource types. For more information about supported resources, see autoscale supported resources.

Discover the autoscale settings in your subscription

To discover the resources that you can autoscale, follow these steps.

  1. Open the Azure portal.

  2. Using the search bar at the top of the page, search for and select Azure Monitor

  3. Select Autoscale to view all the resources for which autoscale is applicable, along with their current autoscale status.

  4. Use the filter pane at the top to select resources a specific resource group, resource types, or a specific resource.

    A screenshot showing resources that can use autoscale and their statuses.

    The page shows the instance count and the autoscale status for each resource. Autoscale statuses are:

    • Not configured: You haven't enabled autoscale yet for this resource.
    • Enabled: You've enabled autoscale for this resource.
    • Disabled: You've disabled autoscale for this resource.

    You can also reach the scaling page by selecting Scaling from the Settings menu for each resource.

    A screenshot showing a resource overview page with the scaling menu item.

Create your first autoscale setting

 Note

In addition to the Autoscale instructions in this article, there's new, automatic scaling in Azure App Service. You'll find more on this capability in the automatic scaling article.

Follow the steps below to create your first autoscale setting.

  1. Open the Autoscale pane in Azure Monitor and select a resource that you want to scale. The following steps use an App Service plan associated with a web app. You can create your first ASP.NET web app in Azure in 5 minutes.

  2. The current instance count is 1. Select Custom autoscale.

  3. Enter a Name and Resource group or use the default.

  4. Select Scale based on a metric.

  5. Select Add a rule. to open a context pane on the right side.

    A screenshot showing the Configure tab of the Autoscale Settings page.

  6. The default rule scales your resource by one instance if the CPU percentage is greater than 70 percent. Keep the default values and select Add.

  7. You've now created your first scale-out rule. Best practice is to have at least one scale in rule. To add another rule, select Add a rule.

  8. Set Operator to Less than.

  9. Set Metric threshold to trigger scale action to 20.

  10. Set Operation to Decrease count by.

  11. Select Add.

    A screenshot showing a scale rule.

    You now have a scale setting that scales out and scales in based on CPU usage, but you're still limited to a maximum of one instance.

  12. Under Instance limits set Maximum to 3

  13. Select Save.

    A screenshot showing the configure tab of the autoscale setting page with configured rules.

You have successfully created your first scale setting to autoscale your web app based on CPU usage. When CPU usage is greater than 70%, an additional instance is added, up to a maximum of 3 instances. When CPU usage is below 20%, an instance is removed up to a minimum of 1 instance. By default there will be 1 instance.

Scheduled scale conditions

The default scale condition defines the scale rules that are active when no other scale condition is in effect. You can add scale conditions that are active on a given date and time, or that recur on a weekly basis.

Scale based on a repeating schedule

Set your resource to scale to a single instance on a Sunday.

  1. Select Add a scale condition.

  2. Enter a description for the scale condition.

  3. Select Scale to a specific instance count. You can also scale based on metrics and thresholds that are specific to this scale condition.

  4. Enter 1 in the Instance count field.

  5. Select Sunday

  6. Set the Start time and End time for when the scale condition should be applied. Outside of this time range, the default scale condition applies.

  7. Select Save

A screenshot showing a scale condition with a repeating schedule.

You have now defined a scale condition that reduces the number of instances of your resource to 1 every Sunday.

Scale differently on specific dates

Set Autoscale to scale differently for specific dates, when you know that there will be an unusual level of demand for the service.

  1. Select Add a scale condition.

  2. Select Scale based on a metric.

  3. Select Add a rule to define your scale-out and scale-in rules. Set the rules to be same as the default condition.

  4. Set the Maximum instance limit to 10

  5. Set the Default instance limit to 3

  6. Enter the Start date and End date for when the scale condition should be applied.

  7. Select Save

A screenshot showing an scale condition for a specific date.

You have now defined a scale condition for a specific day. When CPU usage is greater than 70%, an additional instance is added, up to a maximum of 10 instances to handle anticipated load. When CPU usage is below 20%, an instance is removed up to a minimum of 1 instance. By default, autoscale will scale to 3 instances when this scale condition becomes active.

Additional settings

View the history of your resource's scale events

Whenever your resource has any scaling event, it's logged in the activity log. You can view the history of the scale events in the Run history tab.

A screenshot showing the run history tab in autoscale settings.

View the scale settings for your resource

Autoscale is an Azure Resource Manager resource. Like other resources, you can see the resource definition in JSON format. To view the autoscale settings in JSON, select the JSON tab.

A screenshot showing the autoscale settings JSON tab.

You can make changes in JSON directly, if necessary. These changes will be reflected after you save them.

Monitor virtual machines with Azure Monitor: Alerts


Monitor virtual machines with Azure Monitor: Alerts

This article is part of the guide Monitor virtual machines and their workloads in Azure MonitorAlerts in Azure Monitor proactively notify you of interesting data and patterns in your monitoring data. There are no preconfigured alert rules for virtual machines, but you can create your own based on data you collect from Azure Monitor Agent. This article presents alerting concepts specific to virtual machines and common alert rules used by other Azure Monitor customers.

This scenario describes how to implement complete monitoring of your Azure and hybrid virtual machine environment:

Data collection

Alert rules inspect data that's already been collected in Azure Monitor. You need to ensure that data is being collected for a particular scenario before you can create an alert rule. See Monitor virtual machines with Azure Monitor: Collect data for guidance on configuring data collection for various scenarios, including all the alert rules in this article.

Azure Monitor provides a set of recommended alert rules that you can quickly enable for any Azure virtual machine. These rules are a great starting point for basic monitoring. But alone, they won't provide sufficient alerting for most enterprise implementations for the following reasons:

  • Recommended alerts only apply to Azure virtual machines and not hybrid machines.
  • Recommended alerts only include host metrics and not guest metrics or logs. These metrics are useful to monitor the health of the machine itself. But they give you minimal visibility into the workloads and applications running on the machine.
  • Recommended alerts are associated with individual machines that create an excessive number of alert rules. Instead of relying on this method for each machine, see Scaling alert rules for strategies on using a minimal number of alert rules for multiple machines.

Alert types

The most common types of alert rules in Azure Monitor are metric alerts and log search alerts. The type of alert rule that you create for a particular scenario depends on where the data that you're alerting on is located.

You might have cases where data for a particular alerting scenario is available in both Metrics and Logs. If so, you need to determine which rule type to use. You might also have flexibility in how you collect certain data and let your decision of alert rule type drive your decision for data collection method.

Metric alerts

Common uses for metric alerts:

  • Alert when a particular metric exceeds a threshold. An example is when the CPU of a machine is running high.

Data sources for metric alerts:

  • Host metrics for Azure virtual machines, which are collected automatically
  • Metrics collected by Azure Monitor Agent from the guest operating system

Log search alerts

Common uses for log search alerts:

  • Alert when a particular event or pattern of events from Windows event log or Syslog are found. These alert rules typically measure table rows returned from the query.
  • Alert based on a calculation of numeric data across multiple machines. These alert rules typically measure the calculation of a numeric column in the query results.

Data sources for log search alerts:

  • All data collected in a Log Analytics workspace

Scaling alert rules

Because you might have many virtual machines that require the same monitoring, you don't want to have to create individual alert rules for each one. You also want to ensure there are different strategies to limit the number of alert rules you need to manage, depending on the type of rule. Each of these strategies depends on understanding the target resource of the alert rule.

Metric alert rules

Virtual machines support multiple resource metric alert rules as described in Monitor multiple resources. This capability allows you to create a single metric alert rule that applies to all virtual machines in a resource group or subscription within the same region.

Start with the recommended alerts and create a corresponding rule for each by using your subscription or a resource group as the target resource. You need to create duplicate rules for each region if you have machines in multiple regions.

As you identify requirements for more metric alert rules, follow this same strategy by using a subscription or resource group as the target resource to:

  • Minimize the number of alert rules you need to manage.
  • Ensure that they're automatically applied to any new machines.

Log search alert rules

If you set the target resource of a log search alert rule to a specific machine, queries are limited to data associated with that machine, which gives you individual alerts for it. This arrangement requires a separate alert rule for each machine.

If you set the target resource of a log search alert rule to a Log Analytics workspace, you have access to all data in that workspace. For this reason, you can alert on data from all machines in the workgroup with a single rule. This arrangement gives you the option of creating a single alert for all machines. You can then use dimensions to create a separate alert for each machine.

For example, you might want to alert when an error event is created in the Windows event log by any machine. You first need to create a data collection rule as described in Collect events and performance counters from virtual machines with Azure Monitor Agent to send these events to the Event table in the Log Analytics workspace. Then you create an alert rule that queries this table by using the workspace as the target resource and the condition shown in the following image.

The query returns a record for any error messages on any machine. Use the Split by dimensions option and specify _ResourceId to instruct the rule to create an alert for each machine if multiple machines are returned in the results.

Screenshot that shows a new log search alert rule with split by dimensions.

Dimensions

Depending on the information you want to include in the alert, you might need to split by using different dimensions. In this case, make sure the necessary dimensions are projected in the query by using the project or extend operator. Set the Resource ID column field to Don't split and include all the meaningful dimensions in the list. Make sure Include all future values is selected so that any value returned from the query is included.

Screenshot that shows a new log search alert rule with split by multiple dimensions.

Dynamic thresholds

Another benefit of using log search alert rules is the ability to include complex logic in the query for determining the threshold value. You can hardcode the threshold, apply it to all resources, or calculate it dynamically based on some field or calculated value. The threshold is applied to resources only according to specific conditions. For example, you might create an alert based on available memory but only for machines with a particular amount of total memory.