Monitor virtual machines with Azure Monitor: Alerts
This article is part of the guide Monitor virtual machines and their workloads in Azure Monitor. Alerts in Azure Monitor proactively notify you of interesting data and patterns in your monitoring data. There are no preconfigured alert rules for virtual machines, but you can create your own based on data you collect from Azure Monitor Agent. This article presents alerting concepts specific to virtual machines and common alert rules used by other Azure Monitor customers.
This scenario describes how to implement complete monitoring of your Azure and hybrid virtual machine environment:
To get started monitoring your first Azure virtual machine, see Monitor Azure virtual machines.
To quickly enable a recommended set of alerts, see Enable recommended alert rules for an Azure virtual machine.
Data collection
Alert rules inspect data that's already been collected in Azure Monitor. You need to ensure that data is being collected for a particular scenario before you can create an alert rule. See Monitor virtual machines with Azure Monitor: Collect data for guidance on configuring data collection for various scenarios, including all the alert rules in this article.
Recommended alert rules
Azure Monitor provides a set of recommended alert rules that you can quickly enable for any Azure virtual machine. These rules are a great starting point for basic monitoring. But alone, they won't provide sufficient alerting for most enterprise implementations for the following reasons:
- Recommended alerts only apply to Azure virtual machines and not hybrid machines.
- Recommended alerts only include host metrics and not guest metrics or logs. These metrics are useful to monitor the health of the machine itself. But they give you minimal visibility into the workloads and applications running on the machine.
- Recommended alerts are associated with individual machines that create an excessive number of alert rules. Instead of relying on this method for each machine, see Scaling alert rules for strategies on using a minimal number of alert rules for multiple machines.
Alert types
The most common types of alert rules in Azure Monitor are metric alerts and log search alerts. The type of alert rule that you create for a particular scenario depends on where the data that you're alerting on is located.
You might have cases where data for a particular alerting scenario is available in both Metrics and Logs. If so, you need to determine which rule type to use. You might also have flexibility in how you collect certain data and let your decision of alert rule type drive your decision for data collection method.
Metric alerts
Common uses for metric alerts:
- Alert when a particular metric exceeds a threshold. An example is when the CPU of a machine is running high.
Data sources for metric alerts:
- Host metrics for Azure virtual machines, which are collected automatically
- Metrics collected by Azure Monitor Agent from the guest operating system
Log search alerts
Common uses for log search alerts:
- Alert when a particular event or pattern of events from Windows event log or Syslog are found. These alert rules typically measure table rows returned from the query.
- Alert based on a calculation of numeric data across multiple machines. These alert rules typically measure the calculation of a numeric column in the query results.
Data sources for log search alerts:
- All data collected in a Log Analytics workspace
Scaling alert rules
Because you might have many virtual machines that require the same monitoring, you don't want to have to create individual alert rules for each one. You also want to ensure there are different strategies to limit the number of alert rules you need to manage, depending on the type of rule. Each of these strategies depends on understanding the target resource of the alert rule.
Metric alert rules
Virtual machines support multiple resource metric alert rules as described in Monitor multiple resources. This capability allows you to create a single metric alert rule that applies to all virtual machines in a resource group or subscription within the same region.
Start with the recommended alerts and create a corresponding rule for each by using your subscription or a resource group as the target resource. You need to create duplicate rules for each region if you have machines in multiple regions.
As you identify requirements for more metric alert rules, follow this same strategy by using a subscription or resource group as the target resource to:
- Minimize the number of alert rules you need to manage.
- Ensure that they're automatically applied to any new machines.
Log search alert rules
If you set the target resource of a log search alert rule to a specific machine, queries are limited to data associated with that machine, which gives you individual alerts for it. This arrangement requires a separate alert rule for each machine.
If you set the target resource of a log search alert rule to a Log Analytics workspace, you have access to all data in that workspace. For this reason, you can alert on data from all machines in the workgroup with a single rule. This arrangement gives you the option of creating a single alert for all machines. You can then use dimensions to create a separate alert for each machine.
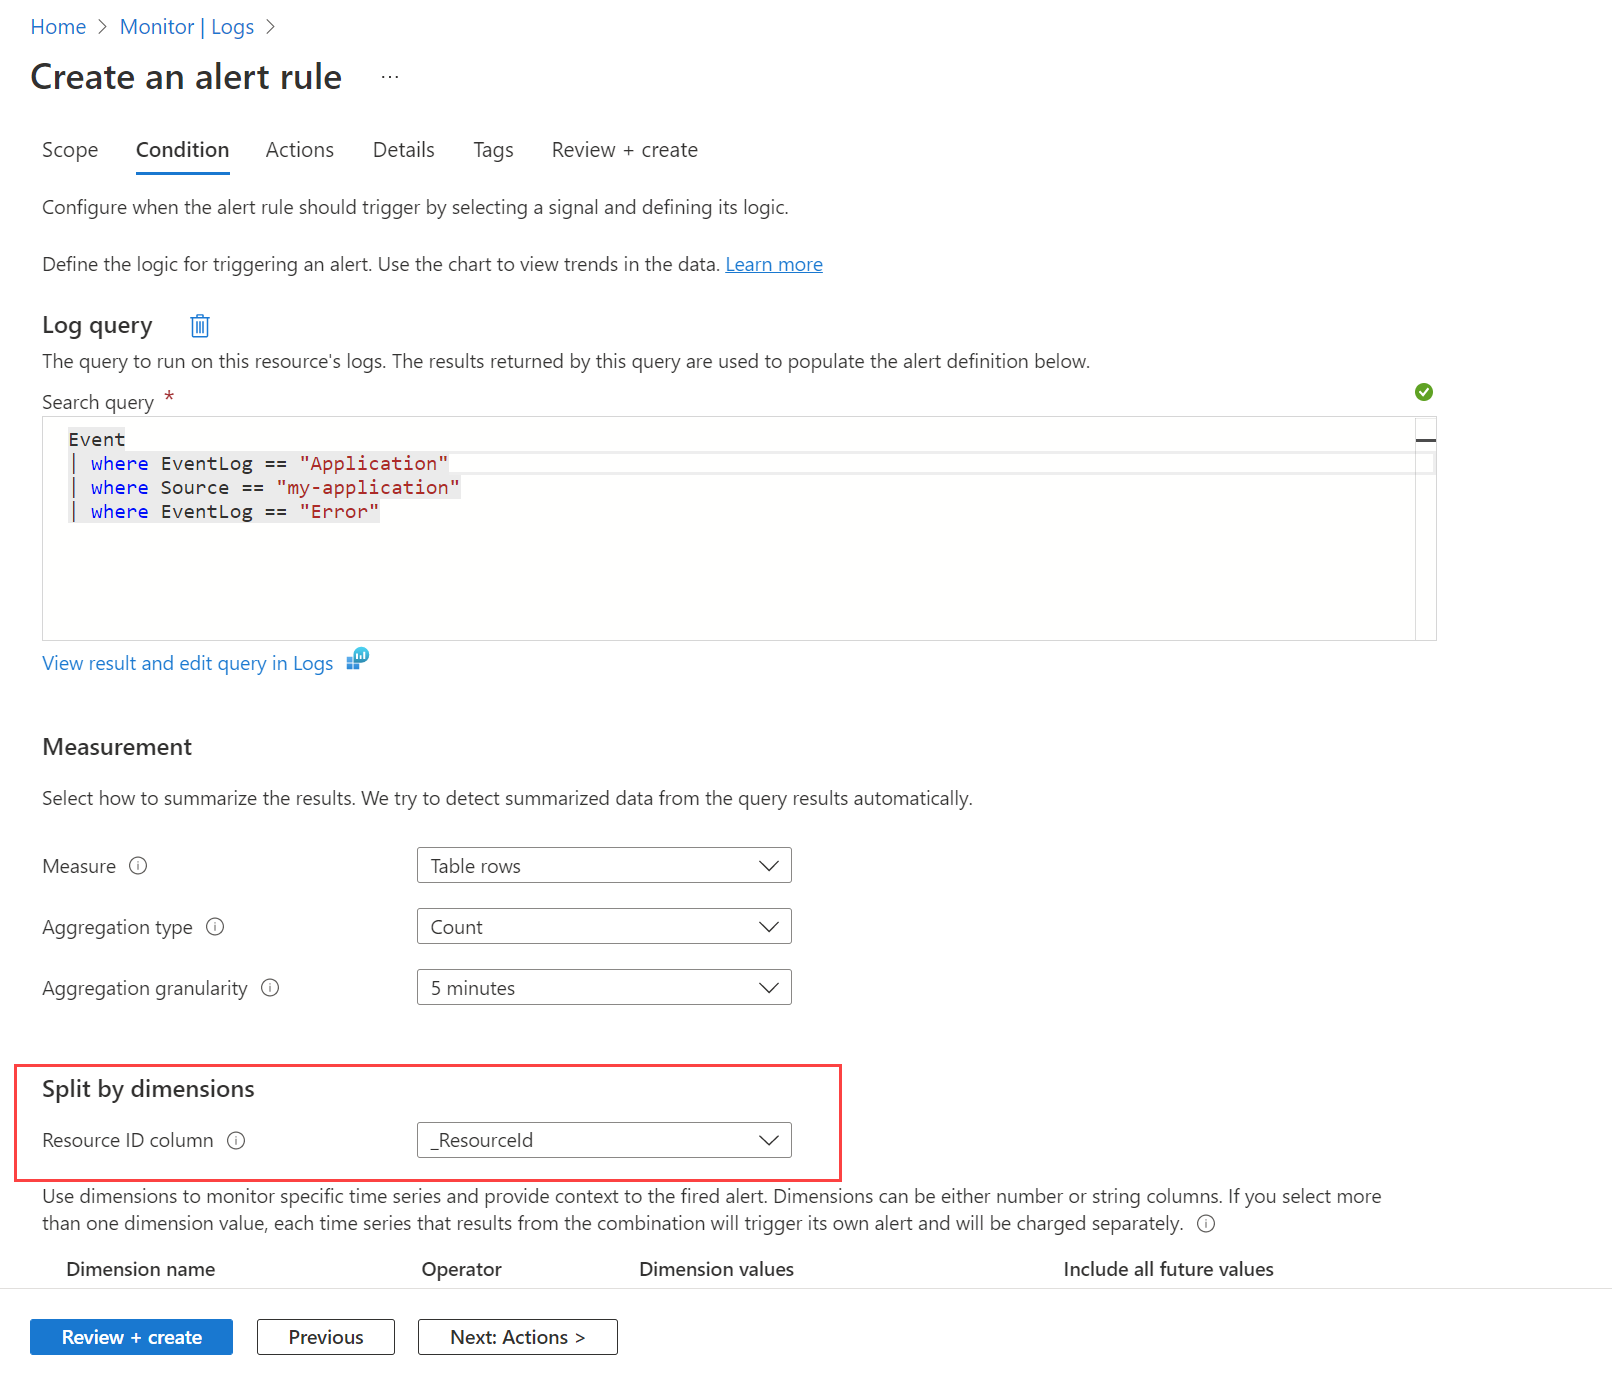
For example, you might want to alert when an error event is created in the Windows event log by any machine. You first need to create a data collection rule as described in Collect events and performance counters from virtual machines with Azure Monitor Agent to send these events to the Event table in the Log Analytics workspace. Then you create an alert rule that queries this table by using the workspace as the target resource and the condition shown in the following image.
The query returns a record for any error messages on any machine. Use the Split by dimensions option and specify _ResourceId to instruct the rule to create an alert for each machine if multiple machines are returned in the results.
Dimensions
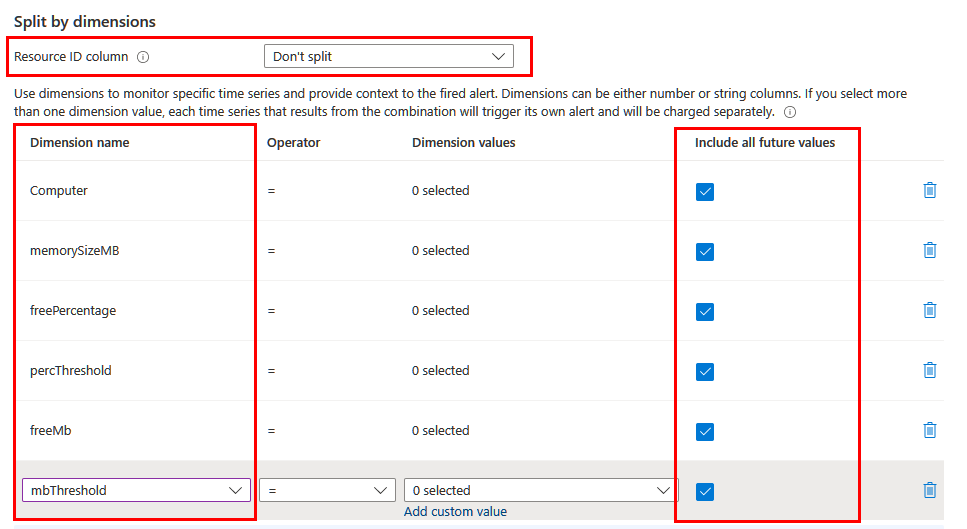
Depending on the information you want to include in the alert, you might need to split by using different dimensions. In this case, make sure the necessary dimensions are projected in the query by using the project or extend operator. Set the Resource ID column field to Don't split and include all the meaningful dimensions in the list. Make sure Include all future values is selected so that any value returned from the query is included.
Dynamic thresholds
Another benefit of using log search alert rules is the ability to include complex logic in the query for determining the threshold value. You can hardcode the threshold, apply it to all resources, or calculate it dynamically based on some field or calculated value. The threshold is applied to resources only according to specific conditions. For example, you might create an alert based on available memory but only for machines with a particular amount of total memory.
No comments:
Post a Comment