Azure Monitor overview
Azure Monitor is a comprehensive monitoring solution for collecting, analyzing, and responding to monitoring data from your cloud and on-premises environments. You can use Azure Monitor to maximize the availability and performance of your applications and services. It helps you understand how your applications are performing and allows you to manually and programmatically respond to system events.
Azure Monitor collects and aggregates the data from every layer and component of your system across multiple Azure and non-Azure subscriptions and tenants. It stores it in a common data platform for consumption by a common set of tools that can correlate, analyze, visualize, and/or respond to the data. You can also integrate other Microsoft and non-Microsoft tools.

The diagram above shows an abstracted view of the monitoring process. A more detailed breakdown of the Azure Monitor architecture is shown in the High level architecture section below.
High level architecture
Azure Monitor can monitor these types of resources in Azure, other clouds, or on-premises:
- Applications
- Virtual machines
- Guest operating systems
- Containers including Prometheus metrics
- Databases
- Security events in combination with Azure Sentinel
- Networking events and health in combination with Network Watcher
- Custom sources that use the APIs to get data into Azure Monitor
You can also export monitoring data from Azure Monitor into other systems so you can:
- Integrate with other third-party and open-source monitoring and visualization tools
- Integrate with ticketing and other ITSM systems
If you're a System Center Operations Manager (SCOM) user, Azure Monitor now includes Azure Monitor SCOM Managed Instance (SCOM MI). Operations Manager MI is a cloud-hosted version of Operations Manager and allows you to move your on-premises Operations Manager installation to Azure.
The following diagram shows a high-level architecture view of Azure Monitor.

Click on the diagram to see a more detailed expanded version showing a larger breakdown of data sources and data collection methods.
The diagram depicts the Azure Monitor system components:
Data sources are the types of resources being monitored.
The data is collected and routed to the data platform. Clicking on the diagram shows these options, which are also called out in detail later in this article.
The data platform stores the collected monitoring data. Azure Monitor's core data platform has stores for metrics, logs, traces, and changes. System Center Operations Manager MI uses its own database hosted in SQL Managed Instance.
The consumption section shows the components that use data from the data platform.
- Azure Monitor's core consumption methods include tools to provide insights, visualize, and analyze data. The visualization tools build on the analysis tools and the insights build on top of both the visualization and analysis tools.
- There are additional mechanisms to help you respond to incoming monitoring data.
The SCOM MI path uses the traditional Operations Manager console that SCOM customers are already familiar with.
Interoperability options are shown in the integrate section. Not all services integrate at all levels. SCOM MI only integrates with Power BI.
Data sources
Azure Monitor can collect data from multiple sources.
The diagram below shows an expanded version of the data source types that Azure Monitor can gather monitoring data from.

Click on the diagram above to see a larger version of the data sources diagram in context.
You can integrate application, infrastructure, and custom data source monitoring data from outside Azure, including from on-premises, and non-Microsoft clouds.
Azure Monitor collects these types of data:
| Data Type | Description and subtypes |
|---|---|
| App/Workloads | App- Application performance, health, and activity data. Workloads - IaaS workloads such as SQL server, Oracle or SAP running on a hosted Virtual Machine. |
| Infrastructure | Container - Data about containers, such as Azure Kubernetes Service, Prometheus, and the applications running inside containers. Operating system - Data about the guest operating system on which your application is running. |
| Azure Platform | Azure resource - Data about the operation of an Azure resource from inside the resource, including changes. Resource Logs are one example. Azure subscription - The operation and management of an Azure subscription, and data about the health and operation of Azure itself. The activity log is one example. Azure tenant - Data about the operation of tenant-level Azure services, such as Microsoft Entra ID. |
| Custom Sources | Data that gets into the system using the - Azure Monitor REST API - Data Collection API |
For detailed information about each of the data sources, see data sources.
SCOM MI (like on premises SCOM) collects only IaaS Workload and Operating System sources.
Data collection and routing
Azure Monitor collects and routes monitoring data using a few different mechanisms depending on the data being routed and the destination. Much like a road system improved over the years, not all roads lead to all locations. Some are legacy, some new, and some are better to take than others given how Azure Monitor has evolved over time. For more information, see data sources.

Click on the diagram to see a larger version of the data collection in context.
| Collection method | Description |
|---|---|
| Application instrumentation | Application Insights is enabled through either Auto-Instrumentation (agent) or by adding the Application Insights SDK to your application code. In addition, Application Insights is in process of implementing Open Telemetry. For more information, reference How do I instrument an application?. |
| Agents | Agents can collect monitoring data from the guest operating system of Azure and hybrid virtual machines. |
| Data collection rules | Use data collection rules to specify what data should be collected, how to transform it, and where to send it. |
| Zero Config | Data is automatically sent to a destination without user configuration. Platform metrics are the most common example. |
| Diagnostic settings | Use diagnostic settings to determine where to send resource log and activity log data on the data platform. |
| Azure Monitor REST API | The Logs Ingestion API in Azure Monitor lets you send data to a Log Analytics workspace in Azure Monitor Logs. You can also send metrics into the Azure Monitor Metrics store using the custom metrics API. |
A common way to route monitoring data to other non-Microsoft tools is using Event hubs. See more in the Integrate section below.
SCOM MI (like on-premises SCOM) uses an agent to collect data, which it sends to a management server running in a SCOM MI on Azure.
For detailed information about data collection, see data collection.
Data platform
Azure Monitor stores data in data stores for each of the three pillars of observability, plus an additional one:
- metrics
- logs
- distributed traces
- changes
Each store is optimized for specific types of data and monitoring scenarios.

Select the preceding diagram to see the Data Platform in the context of the whole of Azure Monitor.
| Pillar of Observability/ Data Store | Description |
|---|---|
| Azure Monitor Metrics | Metrics are numerical values that describe an aspect of a system at a particular point in time. Azure Monitor Metrics is a time-series database, optimized for analyzing time-stamped data. Azure Monitor collects metrics at regular intervals. Metrics are identified with a timestamp, a name, a value, and one or more defining labels. They can be aggregated using algorithms, compared to other metrics, and analyzed for trends over time. It supports native Azure Monitor metrics and Prometheus metrics. |
| Azure Monitor Logs | Logs are recorded system events. Logs can contain different types of data, be structured or free-form text, and they contain a timestamp. Azure Monitor stores structured and unstructured log data of all types in Azure Monitor Logs. You can route data to Log Analytics workspaces for querying and analysis. |
| Traces | Distributed tracing allows you to see the path of a request as it travels through different services and components. Azure Monitor gets distributed trace data from instrumented applications. The trace data is stored in a separate workspace in Azure Monitor Logs. |
| Changes | Changes are a series of events in your application and resources. They're tracked and stored when you use the Change Analysis service, which uses Azure Resource Graph as its store. Change Analysis helps you understand which changes, such as deploying updated code, may have caused issues in your systems. |
Distributed tracing is a technique used to trace requests as they travel through a distributed system. It allows you to see the path of a request as it travels through different services and components. It helps you to identify performance bottlenecks and troubleshoot issues in a distributed system.
For less expensive, long-term archival of monitoring data for auditing or compliance purposes, you can export to Azure Storage.
SCOM MI is similar to SCOM on-premises. It stores its information in an SQL Database, but uses SQL Managed Instance because it's in Azure.
Consumption
The following sections outline methods and services that consume monitoring data from the Azure Monitor data platform.
All areas in the consumption section of the diagram have a user interface that appears in the Azure portal.
The top part of the consumption section applies to Azure Monitor core only. SCOM MI uses the traditional Ops Console running in the cloud. It can also send monitoring data to Power BI for visualization.
The Azure portal
The Azure portal is a web-based, unified console that provides an alternative to command-line tools. With the Azure portal, you can manage your Azure subscription using a graphical user interface. You can build, manage, and monitor everything from simple web apps to complex cloud deployments in the portal. The Monitor section of the Azure portal provides a visual interface that gives you access to the data collected for Azure resources and an easy way to access the tools, insights, and visualizations in Azure Monitor.

Insights
Some Azure resource providers have curated visualizations that provide a customized monitoring experience and require minimal configuration. Insights are large, scalable, curated visualizations.

The following table describes some of the larger insights:
| Insight | Description |
|---|---|
| Application Insights | Application Insights monitors the availability, performance, and usage of your web applications. |
| Container Insights | Container Insights gives you performance visibility into container workloads that are deployed to managed Kubernetes clusters hosted on Azure Kubernetes Service. Container Insights collects container logs and metrics from controllers, nodes, and containers that are available in Kubernetes through the Metrics API. After you enable monitoring from Kubernetes clusters, these metrics and logs are automatically collected for you through a containerized version of the Log Analytics agent for Linux. |
| VM Insights | VM Insights monitors your Azure VMs. It analyzes the performance and health of your Windows and Linux VMs and identifies their different processes and interconnected dependencies on external processes. The solution includes support for monitoring performance and application dependencies for VMs hosted on-premises or another cloud provider. |
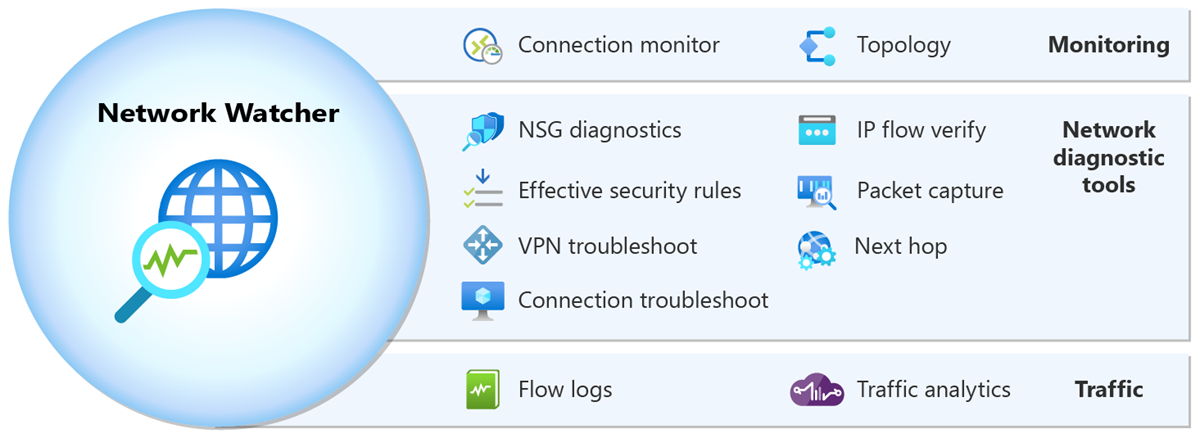
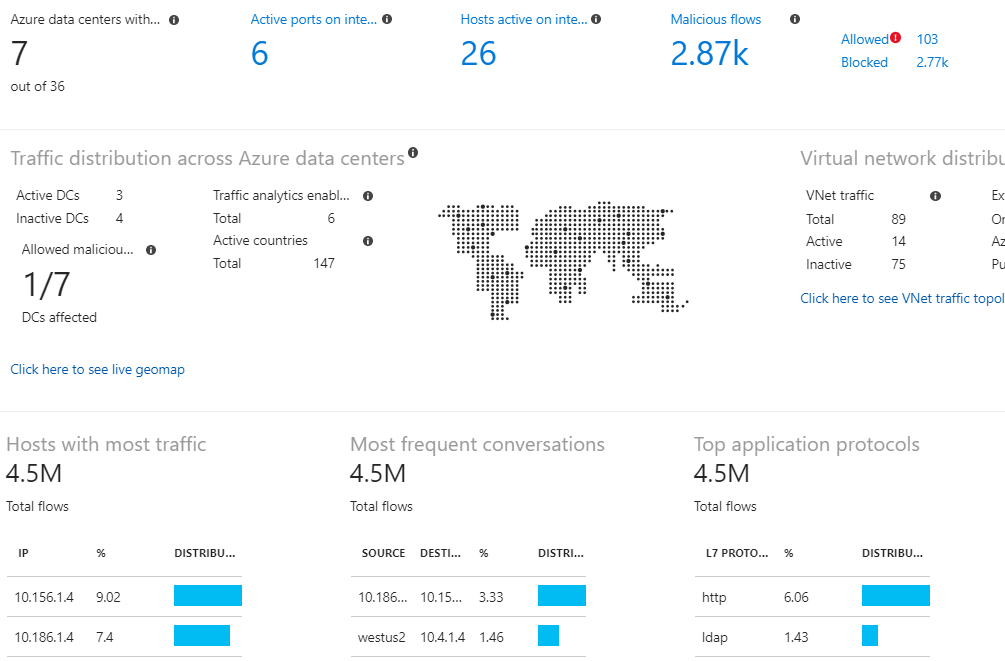
| Network Insights | Network Insights provides a comprehensive and visual representation through topologies, of health and metrics for all deployed network resources, without requiring any configuration. It also provides access to network monitoring capabilities like Connection Monitor, flow logging for network security groups (NSGs), and Traffic Analytics and other diagnostic features. |
For more information, see the list of insights and curated visualizations in the Azure Monitor Insights overview.
Visualize

Visualizations such as charts and tables are effective tools for summarizing monitoring data and presenting it to different audiences. Azure Monitor has its own features for visualizing monitoring data and uses other Azure services for publishing it to different audiences. Power BI and Grafana are not officially part of the Azure Monitor product, but they're a core integration and part of the Azure Monitor story.
| Visualization | Description |
|---|---|
| Dashboards | Azure dashboards allow you to combine different kinds of data into a single pane in the Azure portal. You can optionally share the dashboard with other Azure users. You can add the output of any log query or metrics chart to an Azure dashboard. For example, you could create a dashboard that combines tiles that show a graph of metrics, a table of activity logs, a usage chart from Application Insights, and the output of a log query. |
| Workbooks | Workbooks provide a flexible canvas for data analysis and the creation of rich visual reports in the Azure portal. You can use them to query data from multiple data sources. Workbooks can combine and correlate data from multiple data sets in one visualization giving you easy visual representation of your system. Workbooks are interactive and can be shared across teams with data updating in real time. Use workbooks provided with Insights, utilize the library of templates, or create your own. |
| Power BI | Power BI is a business analytics service that provides interactive visualizations across various data sources. It's an effective means of making data available to others within and outside your organization. You can configure Power BI to automatically import log data from Azure Monitor to take advantage of these visualizations. |
| Grafana | Grafana is an open platform that excels in operational dashboards. All versions of Grafana include the Azure Monitor data source plug-in to visualize your Azure Monitor metrics and logs. Azure Managed Grafana also optimizes this experience for Azure-native data stores such as Azure Monitor and Azure Data Explorer. In this way, you can easily connect to any resource in your subscription and view all resulting monitoring data in a familiar Grafana dashboard. It also supports pinning charts from Azure Monitor metrics and logs to Grafana dashboards. Grafana has popular plug-ins and dashboard templates for non-Microsoft APM tools such as Dynatrace, New Relic, and AppDynamics as well. You can use these resources to visualize Azure platform data alongside other metrics from higher in the stack collected by these other tools. It also has AWS CloudWatch and GCP BigQuery plug-ins for multicloud monitoring in a single pane of glass. |
Analyze
The Azure portal contains built-in tools that allow you to analyze monitoring data.

| Tool | Description |
|---|---|
| Metrics explorer | Use the Azure Monitor metrics explorer user interface in the Azure portal to investigate the health and utilization of your resources. Metrics explorer helps you plot charts, visually correlate trends, and investigate spikes and dips in metric values. Metrics explorer contains features for applying dimensions and filtering, and for customizing charts. These features help you analyze exactly the data you need in a visually intuitive way. |
| Log Analytics | The Log Analytics user interface in the Azure portal helps you query the log data collected by Azure Monitor so that you can quickly retrieve, consolidate, and analyze collected data. After creating test queries, you can then directly analyze the data with Azure Monitor tools, or you can save the queries for use with visualizations or alert rules. Log Analytics workspaces are based on Azure Data Explorer, using a powerful analysis engine and the rich Kusto query language (KQL).Azure Monitor Logs uses a version of the Kusto Query Language suitable for simple log queries, and advanced functionality such as aggregations, joins, and smart analytics. You can get started with KQL quickly and easily. NOTE: The term "Log Analytics" is sometimes used to mean both the Azure Monitor Logs data platform store and the UI that accesses that store. Previous to 2019, the term "Log Analytics" did refer to both. It's still common to find content using that framing in various blogs and documentation on the internet. |
| Change Analysis | Change Analysis is a subscription-level Azure resource provider that checks resource changes in the subscription and provides data for diagnostic tools to help users understand what changes might have caused issues. The Change Analysis user interface in the Azure portal gives you insight into the cause of live site issues, outages, or component failures. Change Analysis uses the Azure Resource Graph to detect various types of changes, from the infrastructure layer through application deployment. |
Respond
An effective monitoring solution proactively responds to critical events, without the need for an individual or team to notice the issue. The response could be a text or email to an administrator, or an automated process that attempts to correct an error condition.

Artificial Intelligence for IT Operations (AIOps) can improve service quality and reliability by using machine learning to process and automatically act on data you collect from applications, services, and IT resources into Azure Monitor. It automates data-driven tasks, predicts capacity usage, identifies performance issues, and detects anomalies across applications, services, and IT resources. These features simplify IT monitoring and operations without requiring machine learning expertise.
Azure Monitor Alerts notify you of critical conditions and can take corrective action. Alert rules can be based on metric or log data.
- Metric alert rules provide near-real-time alerts based on collected metrics.
- Log search alert rules based on logs allow for complex logic across data from multiple sources.
Alert rules use action groups, which can perform actions such as sending email or SMS notifications. Action groups can send notifications using webhooks to trigger external processes or to integrate with your IT service management tools. Action groups, actions, and sets of recipients can be shared across multiple rules.

SCOM MI currently uses its own separate traditional SCOM alerting mechanism in the Ops Console.
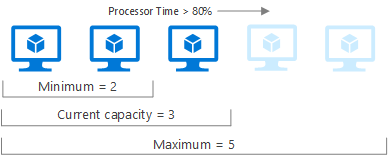
Autoscale allows you to dynamically control the number of resources running to handle the load on your application. You can create rules that use Azure Monitor metrics to determine when to automatically add resources when the load increases or remove resources that are sitting idle. You can specify a minimum and maximum number of instances, and the logic for when to increase or decrease resources to save money and to increase performance.
Azure Logic Apps is also an option. For more information, see the Integrate section below.
Integrate
You may need to integrate Azure Monitor with other systems or to build custom solutions that use your monitoring data. These Azure services work with Azure Monitor to provide integration capabilities. Below are only a few of the possible integrations.

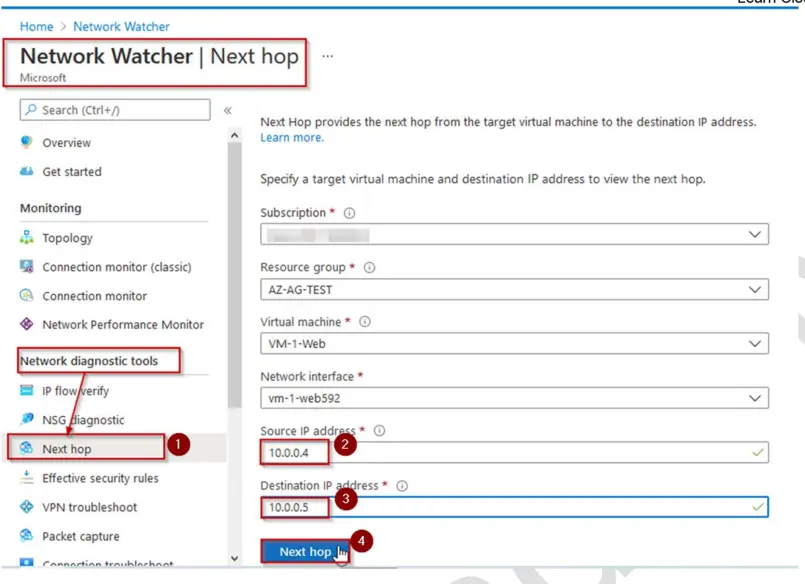
 5. On Next Hop under Network diagnostic tools, enter the following: