Thursday, 15 June 2023

Amazon Web Services – Scaling Amazon EC2

 Scalability refers to the capacity of a software solution to manage rising workloads. In simple terms, it is the ability of a system to readily add extra processing resources to handle the increased loads. 

Scaling Amazon EC2 means you start with the resources you require at the time of starting your service and build your architecture to automatically scale in or out, in response to the changing demand. As a result, you only pay for the resources you really utilize. You don’t have to be concerned about running out of computational power to satisfy your consumer’s demand.

Let’s look at an example. Let’s say you try to access a website, and it works flawlessly with no latency. Now, at peak times, the same website doesn’t load or gets timed out often. This is due to the fact that the website started receiving more requests than it could manage.
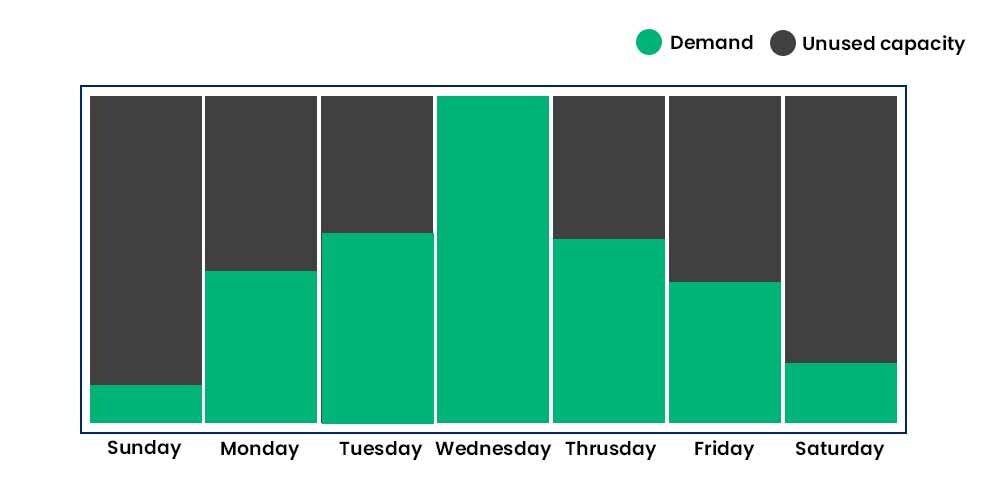
Scaling-Amazon-EC2-Used-and-Unused-Capacity

That’s the point where Amazon EC2 Autoscaling comes into the picture. You may use Amazon EC2 Auto Scaling in order to add or delete Amazon EC2 instances with respect to changes in your application demand. You can maintain a higher feeling of application availability by dynamically scaling your instances in and out as needed. 

You can use three scaling techniques within Amazon EC2 Auto Scaling i.e. Dynamic Scaling, Predictive Scaling, and Scheduled Scaling. They are explained in detail below:

1. Dynamic Scaling adapts to changing environments and responds with the EC2 instances as per the demand. It helps the user to follow the demand curve for the application, which ultimately helps the maintainer/user to scale the instances ahead of time. Target tracking scaling policies, for example, may be used to choose a loaded statistic for your application, such as CPU use. Alternatively, you might use Application Load Balancer’s new “Request Count Per Target” measure, which is a load balancing option for the Elastic Load Balancing service. After that, Amazon EC2 Auto Scaling will modify the number of EC2 instances as needed to keep you on track. 

2. Predictive Scaling helps you to schedule the right number of EC2 instances based on the predicted demand. You can use both dynamic and predictive scaling approaches together for faster scaling of the application. Predictive Scaling forecasts future traffic and allocates the appropriate number of EC2 instances ahead of time. Machine learning algorithms in Predictive Scaling identify changes in daily and weekly patterns and automatically update projections. In this way, the need to manually scale the instances on particular days is relieved. 

3. Scheduled Scaling, as the name suggests allows you to scale your application based on the scheduled time you set. For e.g. A coffee shop owner may employ more baristas on weekends because of the increased demand and frees them on weekdays because of reduced demand.

Computing power is a programmed resource in the cloud, so you may take a more flexible approach to scale your applications. When you add Amazon EC2 Auto Scaling to an application, you may create new instances as needed and terminate them when they’re no longer in use. In this way, you only pay for the instances you use, when they’re in use.

Some Ways to scale Amazon EC2:

  • Horizontal Scaling: Horizontal scaling involves adding more instances to your application to handle increased demand. This can be done manually by launching additional instances, or automatically using Amazon EC2 Auto Scaling, which monitors your application’s workload and adds or removes instances based on predefined rules.
  • Vertical Scaling: Vertical scaling involves increasing the resources of existing instances, such as CPU, memory, or storage. This can be done manually by resizing instances, or automatically using Amazon EC2 Auto Scaling with launch configurations that specify instance sizes based on the workload.
  • Load Balancing: Load balancing involves distributing incoming traffic across multiple instances to improve performance and availability. Amazon Elastic Load Balancing (ELB) is a service that automatically distributes incoming traffic across multiple instances in one or more Availability Zones.
  • Multi-Availability Zone Deployment: Multi-Availability Zone (AZ) deployment involves launching instances in multiple AZs to improve availability and fault tolerance. Amazon EC2 Auto Scaling can be used to automatically launch instances in additional AZs to maintain availability in case of an AZ outage.
  • Containerization: Containerization involves using containers to package and deploy applications, making them more portable and easier to manage. Amazon Elastic Container Service (ECS) is a service that makes it easy to run, stop, and manage Docker containers on a cluster of EC2 instances.

Benefits of Auto Scaling EC2:

Scaling as discussed should be implemented in an EC2 instance, in order to achieve more flexibility if the demand for application increases. Let’s discuss what are the detailed benefits of Auto Scaling an EC2. 
A method to make the most of AWS Cloud is to incorporate Amazon EC2 Auto Scaling into your application design. The applications benefit the following when you use Amazon EC2 Auto Scaling:

  1. Amazon EC2 Auto Scaling ensures that your application has enough capacity to handle current traffic demand at all times. This means your application can add or remove new and old instances respectively with respect to the demand of the application. The feature of auto adding and terminating the instances as per demand is termed as Better Availability of the application.
  2. Suppose an instance, becomes unhealthy by the time and is in use despite this fact. The chances of its crashing increase. Here comes another use case of Auto Scaling EC2. It will recognize which instance is not healthy or in technical terms which instance is slow, low efficient, etc, and automatically terminated the instance and replace it with a brand new instance. Furthermore, a user can employ several availability zones with Amazon EC2 Auto Scaling. If one zone goes down or crashes, EC2 Auto Scaling compensates the same by launching instances in other zones. In this way, the traffic is can be migrated to the other zone in which new instances are added in order to manage traffic till the crashed zone gets healthy again.
  3. Auto Scaling is highly cost-efficient and must be employed if you’re not sure about the traffic that your application will be receiving. As per the need, Amazon EC2 Auto Scaling can dynamically raise and reduce capacity. The user can save money by this as only according to the demand, new instances will be created and will be charged. As soon as the traffic to the application reduces, some instances get terminated and in this way, you use and pay for the instance that you really need.

Limitations of EC2 Autoscaling:

There are several limitations to consider when using Amazon EC2 Auto Scaling:

  1. Number of instances: Amazon EC2 Auto Scaling can support a maximum of 500 instances per Auto Scaling group.
  2. Instance health checks: Auto Scaling uses Amazon EC2 instance health checks to determine the health of an instance. If an instance fails a health check, Auto Scaling will terminate it and launch a new one. However, this process can take some time, which can impact the availability of your application.
  3. Scaling policies: Auto Scaling allows you to set scaling policies based on CloudWatch metrics, but these policies can be complex to configure and may not always scale your application as expected.
  4. Application dependencies: If your application has dependencies on other resources or services, such as a database or cache, it may not scale as expected if those resources become overloaded or unavailable.
  5. Cost: Using Auto Scaling can increase the cost of running your application, as you may be charged for the additional instances that are launched.

Overall, it’s important to carefully consider the limitations of Amazon EC2 Auto Scaling and how they may impact your application when deciding whether to use this service.

How does EC2 Autoscaling work?

Amazon EC2 Autoscaling provides the liberty to automatically scale the instances as per the demand. Even if some problems are detected, the model replaces the unhealthy instances with ones that are fully functional. To automate fleet management for EC2 instances, Amazon EC2 Auto Scaling will perform three major functions:

  • Balancing the capacities across different Availability zones: If your application has three availability zones, Amazon EC2 Autoscaling can help you balance the number of instances across the three zones. As a result, each zone receives no more or fewer instances than the others, resulting in a balanced distribution of traffic and burden.
  • Replacing and Repairing unhealthy instances: If the instances fail to pass the health check, Autoscaling replaces them with healthy instances. As a result, the problem of instances crashing is reduced, and you won’t have to manually verify their health or replace them if they’re determined to be unhealthy.
  • Monitoring the health of instances: While the instances are running, Amazon EC2 Auto Scaling ensures that they are healthy and that traffic is evenly allocated among them. It does health checks on the instances on a regular basis to see if they’re experiencing any issues.
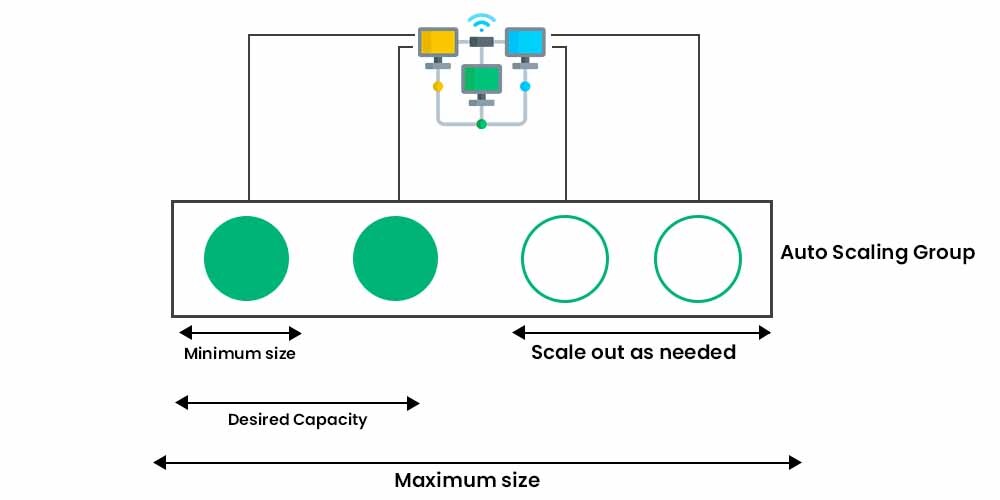
Amazon-Web-Services-Scaling-Amazon-EC2


Bash Script – Features

 These days, there are various shell writing options available out there, and each one of them has its own unique features. Just as it does, Bash Shell contains some of the best features that make it more productive and usable. For each project, there are specific requirements for the features, and the developers choose the shell according to those specific features. Therefore, it is important that you know about the features of Bash  Scripting before you start using it. Some of the key features of Bash Shell Scripting are provided here

1. Compatibility

Bash goes with .sh as it comes out of the original UNIX Bourne shell and is included with the excellent and useful features of Korn and C Shell, such as cheat guide, function, control, etc.

2. Persuasion

In expanding the single-character command-line options (i.e., -b, -c, -4, etc.), which can be configured using the shell set in Command, there are a few multi-character options. (i.e., -debugger, -help, -login, etc.) that you can use with Bash Shell Scripting

3. Bash Launch Files

Bash launcher files are read and used scripts when Bash is launched. Each file has its own unique application, and a collection of these files is used to create an environment.

4. Interacting shells

The interactive shell usually reads from the user terminal and writes. Input and output are connected to the terminal. Bash interactive behavior is initiated when the bash command is requested without optional arguments, except when the option is to learn from the song or when the shell is invited to learn from the standard input, which allows you to set location parameters.

5. Conditionals

Conditional statements are supported and can be implemented by – [[ integrated command check and [built-in commands.

6. Shell Arithmetic

The shell allows for the exploration of arithmetic expressions, such as a shell extension.

7. Aliases

An Alias allows a character unit or set of commands that instead of a word that can be easily used as a command which maintains a list of shell nicknames that can be set with the names and instructions of the Alias. Also, It reduces tasks and consumes less time.

8. Lists

Bash uses the same one-sided members using which you can easily refer to and manage the data list.

9. Document Stack

The stack list is a list that shows a recent visit. The built-in command pushd adds references to the stack as it replaces the current index, and the built-in popd removes the references mentioned in the stack and converts the current directory back to the extracted directory. To display the content, the built-in dirs are removed.

Wednesday, 14 June 2023

Difference between AWS Cloudwatch and AWS Cloudtrail

Difference between AWS Cloudwatch and AWS Cloudtrail


1. AWS Cloudwatch: 

It is a monitoring tool used for real-time monitoring of AWS resources and applications. It provides a report on the basis of monitoring which can be used to analyze the performance of the system.  CloudWatch also detect irregular behavior in your environments. It also sets the alarm. It monitors various AWS resources like Amazon EC2, Amazon RDS, Amazon S3, Elastic Load Balancer, etc. 

2. AWS Cloudtrail:

 It is a service that enables governance, compliance, operational auditing, and risk auditing of your AWS account. It continuously logs and monitors the activities and actions across your AWS account. It also provides the event history of your AWS account including information about who is accessing your AWS services.  Remediation actions are also taken by cloudtrail.      

S.No.AWS CloudwatchAWS Cloudtrail
1.It is mainly concerned with happenings on AWS resources.It is mainly concerned with what is done on AWS and by whom.
2.It is a monitoring service for AWS resources and applications.It records API activity in the AWS account.
3.Using Cloudwatch you can track metrics and monitor log files. You can also set alarm for various events.CloudTrail provides greater visibility into user activity by tracking AWS console actions including who made the call, from which IP address and when.
4.It specifically records the application logs.It provides information about what occurred in your AWS account.
5.It delivers metric data in 1 minute period for detailed monitoring and 5 minute periods for basic monitoring.It delivers an event within 15 minutes of the API call.
6.It stores data in its own dashboard in the form of metrics and logs.It can centralize all the logs across regions and even across many accounts and store them on S3 bucket.
7.It offers free basic monitoring resources by default, such as EC2 instances, RDS, etc.It is enabled by default when AWS account is created and start working from then.
8.AWS CloudWatch focuses on the health of aws resources.AWS CloudTrail focuses on the activities performed inside the aws environment.
9.It provides offers to collect, analyze and monitor applications health.It provides Auditing services for AWS accounts.
10.In CloudWatch, Logs are saved in Particular group.In CloudTrail, Logs are saved in S3 Bucket.
11.AWS CloudWatch is available in free and premium pricing models.AWS CloudTrail is free. If you want to put up a single trail to deliver a single copy of management events.
12.Companies using CloudWatch are Airbnb and 9GAG.Companies using CloudTrail are Netflix and Slack.

Tuesday, 30 May 2023

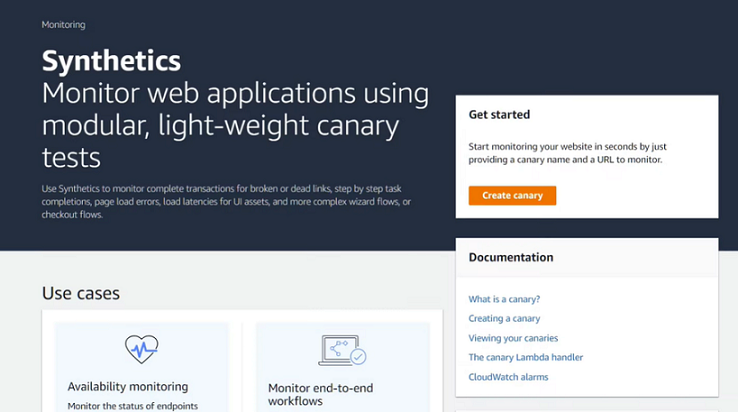
Introduction to Amazon CloudWatch Synthetics

 In this article, we will get an introduction to Amazon Cloudwatch Synthetics. With this feature, you can create different kinds of Canaries to continually verify your user experience even when you don’t have traffic, monitor and test for unusual behavior, and trace issues to their source for faster resolution.

Let’s start by navigating to CloudWatch synthetics.

Amazon CloudWatch synthetics allows you to create configurable scripts called canaries to continuously monitor your application endpoints and APIs. By using canaries you can discover issues with your website before your customers do. 

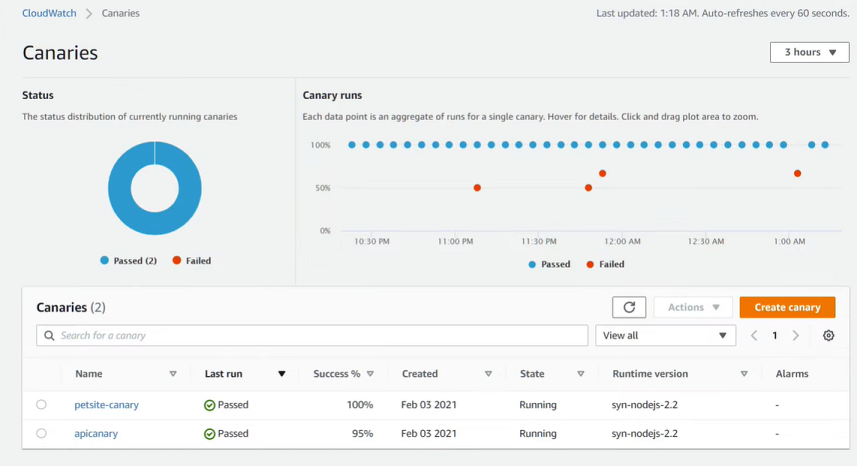
Here we already have two canaries monitoring our sample pet adoption site. 

Let’s create a third Canary. The canaries can be created from pre-existing blueprints from scripts that can be edited inline or by using a workflow builder or a canary recorder. 

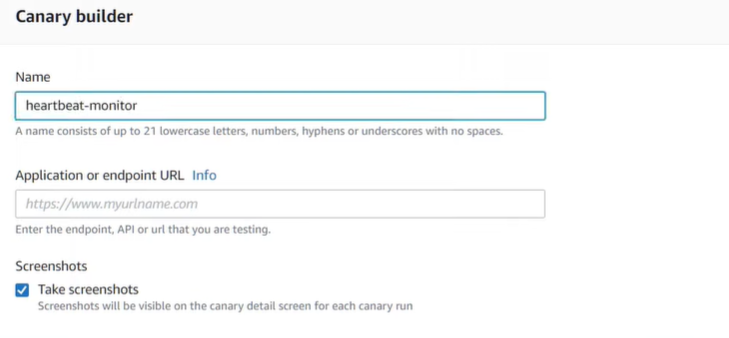
For this canary, we’ll use the Heartbeat monitoring blueprint. The heartbeat scripts load the specified URL and store a screenshot of the page, an HTTP archive file, and logs of accessed URLs. We’ll enter the URL for our sample pet adoption site in this case.

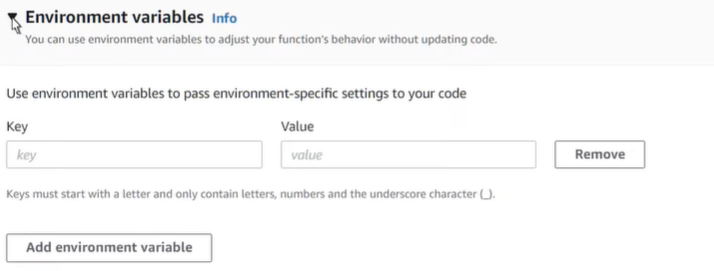
Let’s move on without inputting any environment variables.

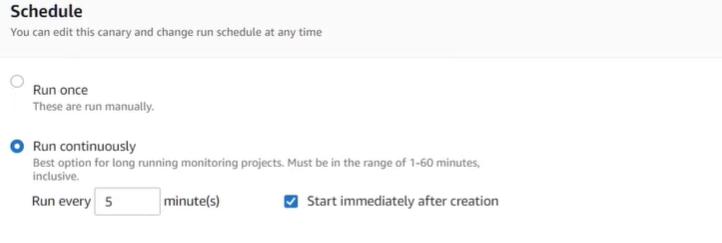
We’ll also retain the default settings for scheduling.

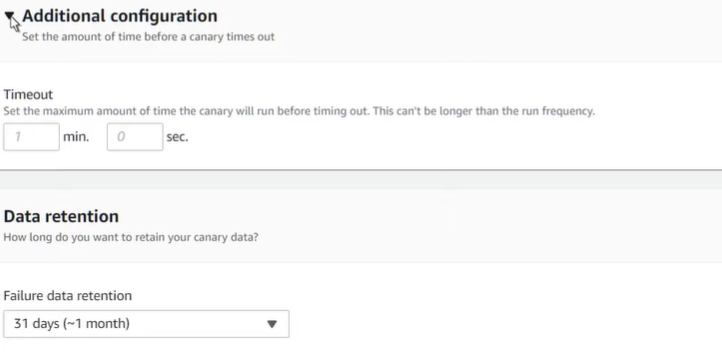
We’ll also keep the default timeout settings. If you have specific data retention policies you can change the default settings here to maintain compliance.

Under access permissions, you can choose whether to create a new identity and access management or IAM role that’s specific to this canary or use an existing role. We’ll create a new role.

You can allow synthetics to create CloudWatch alarms for your canary automatically. Let’s add an alarm that will notify us via an Amazon SNS, for if our canary fails two or more times in 15 minutes.

If your endpoint is under a virtual private cloud you can select it here.

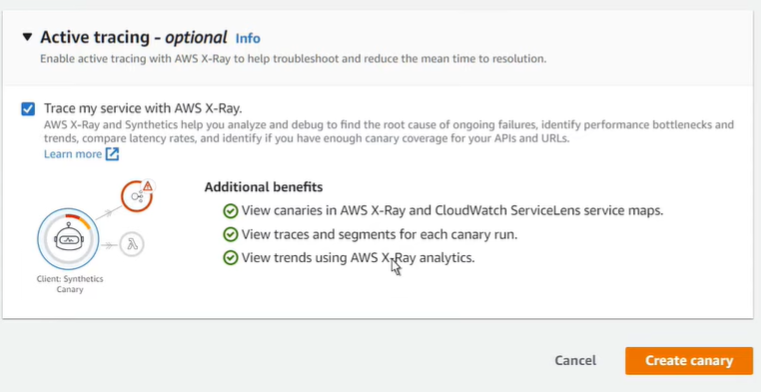
CloudWatch synthetics can be integrated with AWS X-ray and CloudWatch service lens service maps. Let’s enable the integration and create the canary.

Our heartbeat monitoring canary has been successfully created. 

Canaries with tracing enabled also appear on the service map in both CloudWatch service lens and an X-ray. Returning to the top of the page we can select the monitoring tab to view graphs of the CloudWatch metrics published by this canary for the selected time range. The configuration tab details current configuration information for the canary including when it was last modified. 

Features:

  1. Canary Tests: CloudWatch Synthetics allows you to create canary tests that simulate user behavior and test the availability and performance of your applications, APIs, and websites. You can create canary tests using pre-built blueprints or by writing your own custom scripts.
  2. Monitoring: CloudWatch Synthetics monitors your canary tests in real-time and provides detailed metrics and logs for each test. It also alerts you when a test fails or experiences performance issues.
  3. Scripting: CloudWatch Synthetics provides a powerful scripting environment that allows you to create custom scripts to test your applications, APIs, and websites. You can use scripting languages such as JavaScript, Python, and PowerShell to write your scripts.
  4. Integrated with CloudWatch: CloudWatch Synthetics is fully integrated with Amazon CloudWatch, which means that you can use CloudWatch to view and analyze your canary test results alongside other metrics and logs.
  5. Simple Pricing: CloudWatch Synthetics is offered at a simple, pay-as-you-go pricing model. You only pay for what you use, and there are no upfront costs or minimum fees.

Introduction to Amazon Cloudwatch

 Amazon CloudWatch is a service used for monitoring and observing resources in real-time, built for DevOps engineers, developers, site reliability engineers (SREs), and IT managers. CloudWatch provides users with data and actionable insights to monitor their respective applications, stimulate system-wide performance changes, and optimize resource utilization. CloudWatch collects monitoring and operational data in the form of logs, metrics, and events, providing its users with an aggregated view of AWS resources, applications, and services that run on AWS. The CloudWatch can also be used to detect anomalous behavior in the environments, set warnings and alarms, visualize logs and metrics side by side, take automated actions and troubleshoot issues.

Terminologies related to Amazon Cloudwatch

Metrics

  • It represents a time-ordered set of data points that are published to Amazon CloudWatch
  • All data point is marked with a timestamp
  • Metric is a variable that is monitored and data points are the value of that variable over time
  • They are uniquely defined by a name, namespace, and zero or more dimensions
  • Metric math is used to query multiple cloudwatch metrics and use math expressions to create new time-series based on these metrics

Dimensions

  • A dimension is a name/value pair which uniquely identifies a metric
  • Dimensions are the unique identifiers for a metric, so whenever you add a unique name/value pair to one of the metrics, you are creating a new variation of that metric.

Statistics

  • Statistics are metric data aggregations over specified periods of time
  • The few available statistics on Cloudwatch are maximum, minimum, sum, average, and sample count.

Alarm

  • It is used  to automatically initiate actions on our behalf
  • It watches a single metric over a specified time period and performs one or more specified actions based on the value of the metric
  • The estimated AWS charges can also be monitored using the alarm

Percentiles

  • It represents the relative weightage of the data in a dataset
  • It helps the user to get a better understanding of the distribution of metric data

Cloudwatch dashboard

  • A user-friendly Cloudwatch console is available which is used for monitoring resources in a single view.
  • There is no limit on the number of cloudwatch dashboards you can create.
  • These dashboards are global and not region-specific

Cloudwatch agent

  • It is required to be installed
  • It collects logs and system-level metrics from EC2 instances and on-premises servers

Cloudwatch Events:

  • Cloudwatch events help you to create a set of rules that match with any event(i.e stopping of EC2 instance).
  • These events can be routed to one or more targets like AWS Lambda functions, Amazon SNS Topics, Amazon SQS queues, and other target types.
  • Cloudwatch Events observes the operational events continuously and whenever there is any change in the state of the event, it performs the action by sending notifications, activating lambda, etc.
  • An event indicates a change in the AWS environment. Whenever there is a change in the state of AWS resources, events are generated.
  • Rules are used for matching events and routing to targets.
  • Target process events. They include Amazon EC2 instances, AWS Lambda functions, etc. A target receives the events in JSON format.

Cloudwatch logs:

  • Amazon Cloudwatch logs enable you to store, monitor, and access files from AWS resources like Amazon EC2 instances, Route53, etc.
  • It also helps you to troubleshoot your system errors and maintain the logs in highly durable storage.
  • It also creates log of information about the DNS queries that Route 53 receives

Amazon Cloudwatch Create

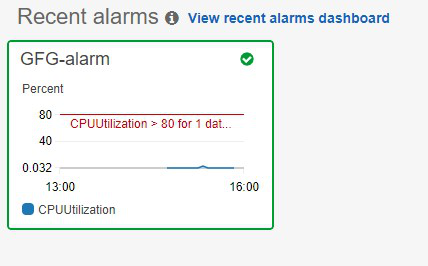
Notifying gfg website management team when the instance on which gfg website is hosted stops Whenever the CPU utilization of instance (on which GeeksForGeeks website is hosted ) goes above 80%, cloudwatch event is triggered. This cloudwatch event then activates the SNS topic which sends the alert email to the attached gfg subscribers.

Step 1: Let us assume that you have already launched an instance with the name tag ‘instance’. 

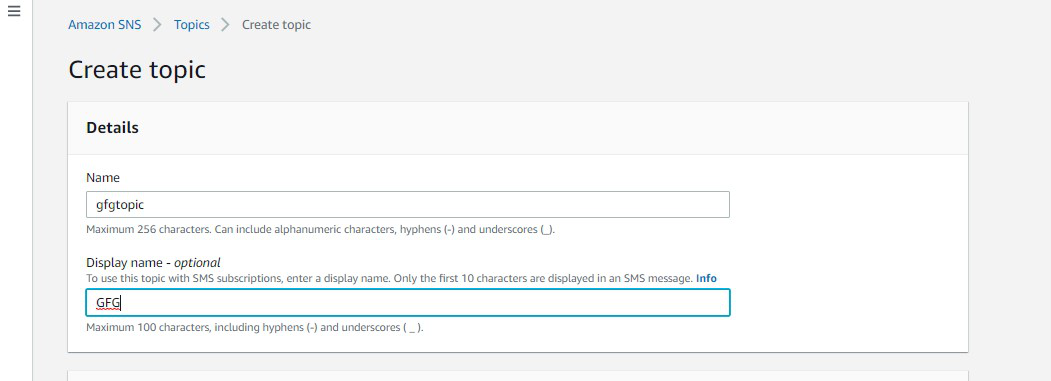
Step 2: Go to SNS topic dashboard and click on create a topic

Step 3: You will be directed to this dashboard. Now specify the name and display name.

Step 4: Scroll down and click on create the topic.

Step 5: The SNS topic is created successfully. 

Step 6: Go to the SNS topic dashboard and click on gfgtopic link.

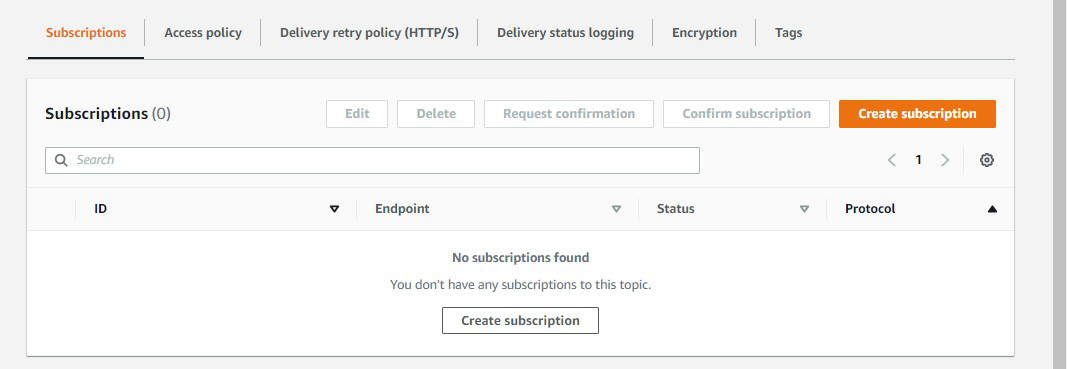
Step 7: Under the subscriptions section, Click on Create subscription.

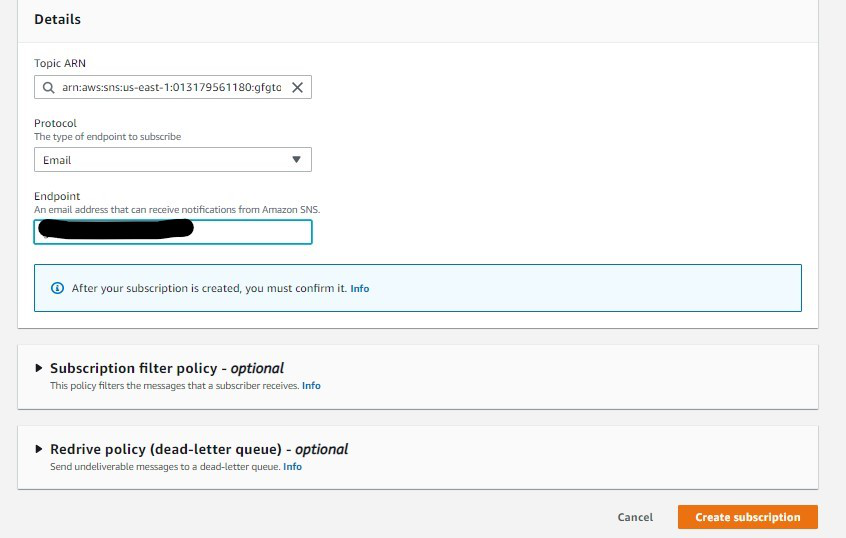
Step 8: Select Email as protocol and specify the email address of subscribers in Endpoint. Click on create the subscription. Now Go to the mailbox of the specified email id and click on Subscription confirmed.

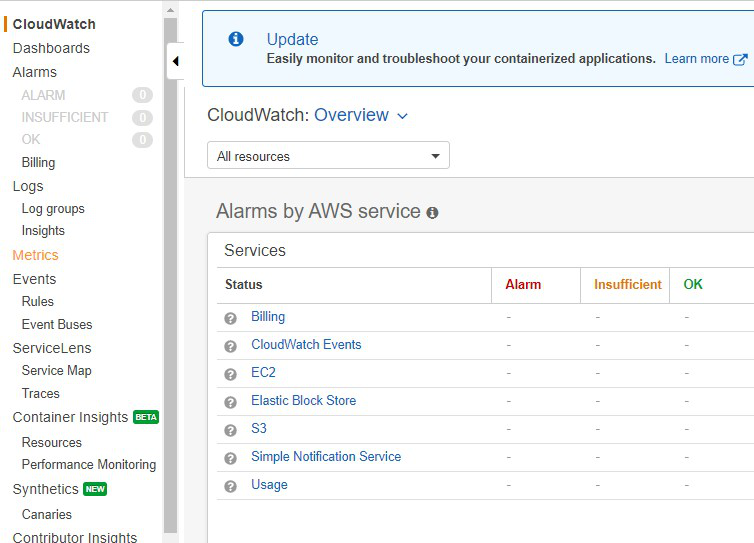
Step 9: Go to the cloudwatch dashboard on the AWS management console. Click on Metrics in the left pane.

Step 10: In All metrics section click on EC2 

Step 11: Click on Per-instance metrics

Step 12: Select the instance you launched

Step 13: Go to Graphed metrics, click on the bell icon

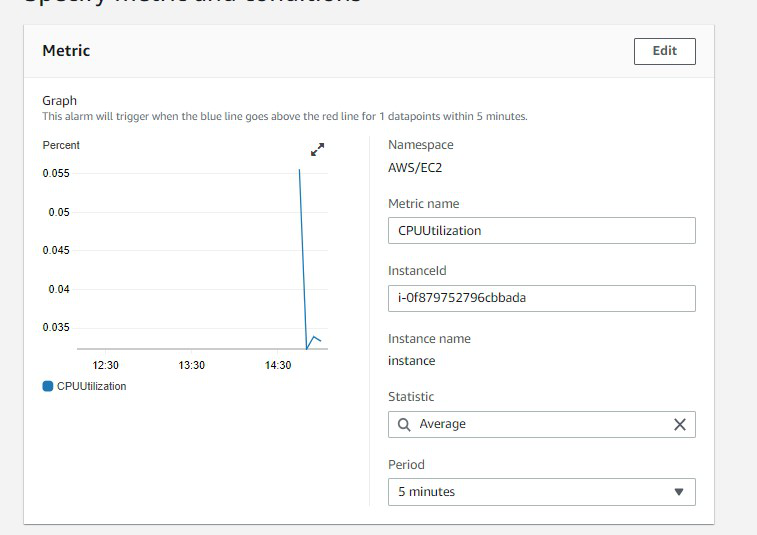
Step 14: This dashboard shows the components of Amazon Cloudwatch such as Namespace, Metric Name, Statistics, etc

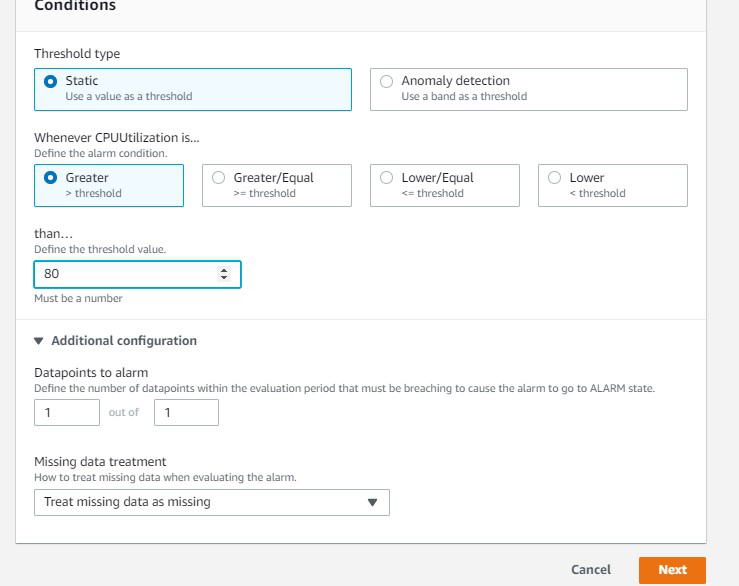
Step 15: Select the greater threshold. Also, specify the amount( i.e 80 ) of the threshold value. Click on Next.

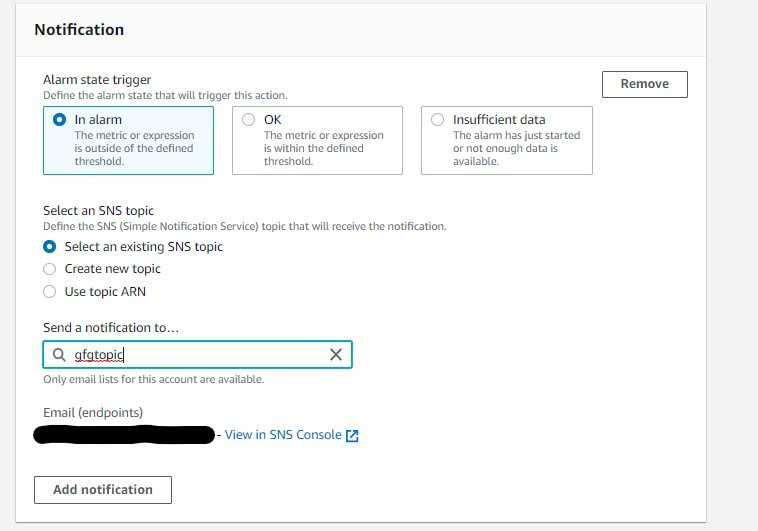
Step 16: Click on Select an existing SNS topic, also mention the name of the SNS topic you created now.

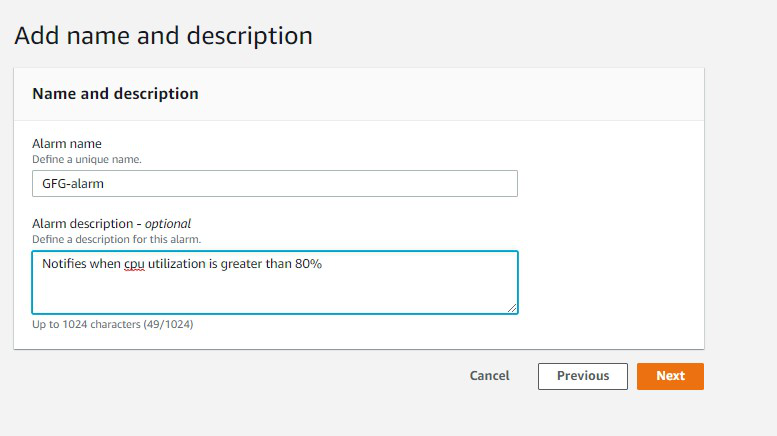
Step 17: Specify the name of alarm and description which is completely optional. Click on Next and then click on Create alarm.

Step 18: The alarm is successfully created.

Step 19: You can see the graph which notifies whenever CPU utilization goes above 80%.

 Use cases for CloudWatch

  • CloudWatch can be used to monitor the performance of AWS resources, applications, and infrastructure components in real-time
  • CloudWatch allows users to set up alarms that trigger notifications or automated actions in response to changes in the state of their resources.
  • CloudWatch can be used to store, search, and analyze log data from various AWS services, applications, and infrastructure components.
  • CloudWatch can be used to monitor the performance of EC2 instances, RDS databases, and other resources, which can then be used to trigger automatic scaling events.

Advantages of Amazon Cloudwatch

  • A large amount of data is produced by web applications nowadays so amazon cloudwatch acts as a dashboard that contains the organized collection of whole data.
  • It improves the total cost of ownership by providing alarms and also takes automated actions when there is an error in limits provided.
  • Applications and resources can be optimized by examining the logs and metric data.
  • Detailed Insights from the application are provided through data like CPU utilization, capacity utilization, memory utilization, etc
  • It provides a great platform to compare and contrast the data produced by various AWS services.

Disadvantages of Amazon Cloudwatch

  • Cloud Watch can be expensive, especially for large-scale monitoring and logging needs.
  • Cloud Watch may not be able to handle large amounts of log data, especially during spikes in usage, making it difficult to maintain a consistent level of monitoring and logging.
  • The monitoring and logging processes of CloudWatch can consume significant system resources, impacting the overall performance of an application.
  • Integrating CloudWatch with other AWS services and third-party tools can be challenging.
  • Setting up and managing CloudWatch can be complex, especially for users who are not familiar with cloud-based systems.