Monitor Microsoft Azure with the Azure Native ISV Service
Create an Elasticsearch resourceedit
Log in to the Azure portal.
- In the search bar, enter Elastic Cloud (Elasticsearch) and then select Elastic Cloud (Elasticsearch) – An Azure Native ISV Service.
- Click Create.
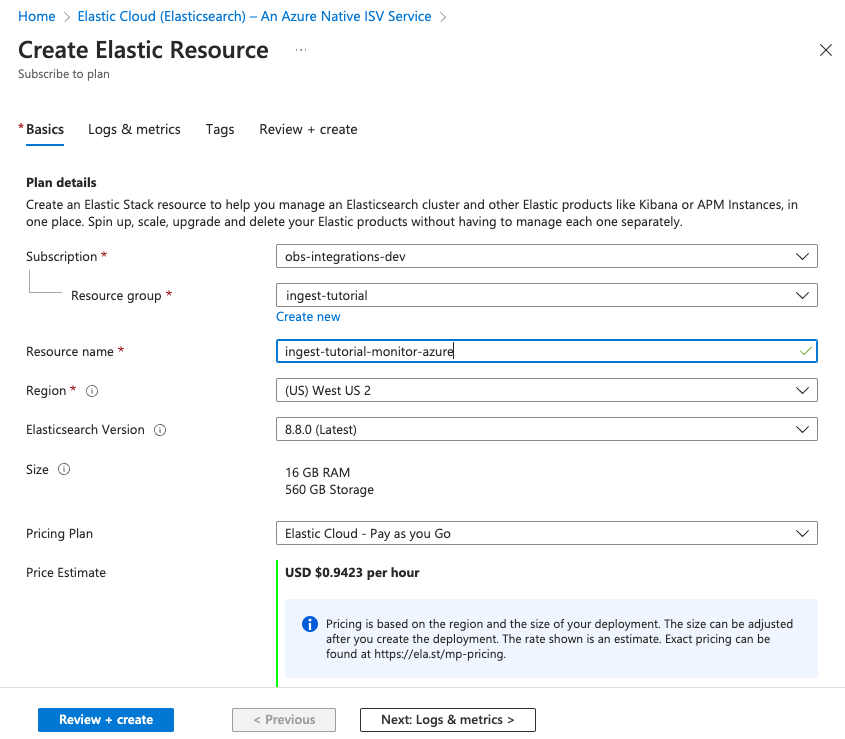
- Enter the Subscription, Resource group, and the Resource name.
- Select an Elasticsearch version.
Select a region and then click Review + create.
- To create the Elasticsearch deployment, click Create.
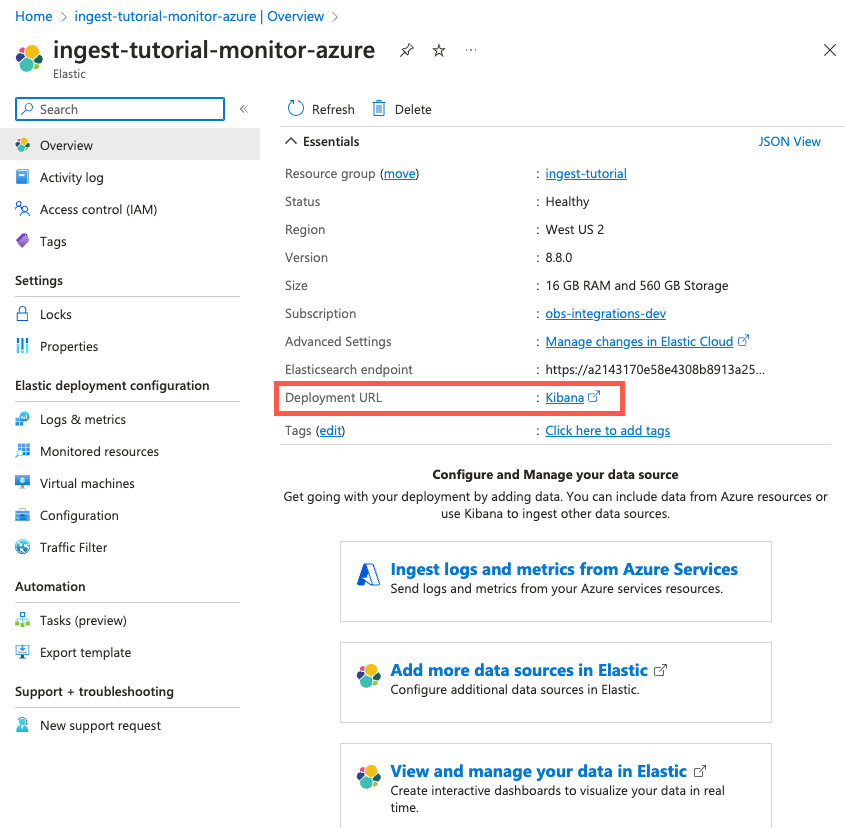
After deployment is complete, click Go to resource. Here you can view and configure your deployment details. To access the cluster, click Kibana.
- Click Accept (if necessary) to grant permissions to use your Azure account, then log in to Elastic Cloud using your Azure credentials as a single sign-on.
- To look for available data, click Observability. There should be no data yet. Next, you’ll ingest logs.
Step 2: Ingest logs by using the Azure Native ISV Serviceedit
To ingest Azure subscription and resource logs into Elastic, you use the Azure Native ISV Service.
- In the Azure portal, go to your Elasticsearch resource page and click Ingest logs and metrics from Azure Services.
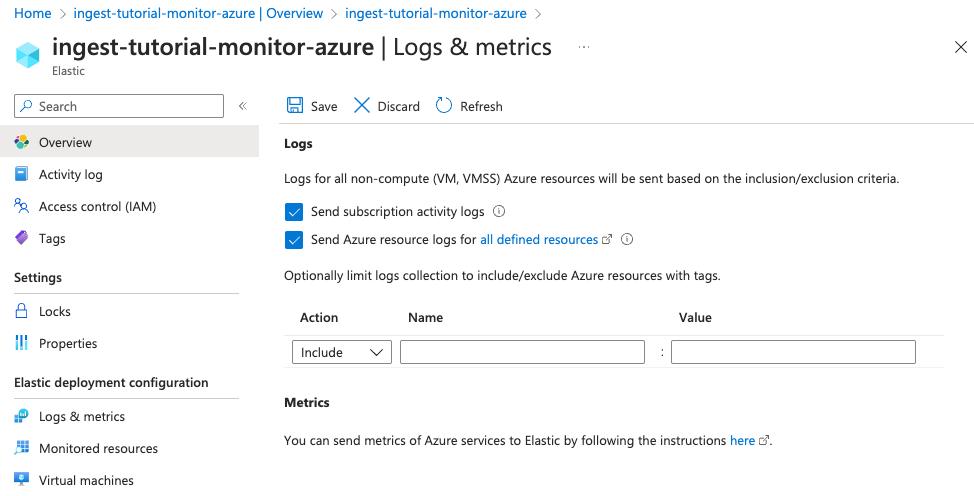
Under Logs, select both checkboxes to collect subscription activity logs and Azure resource logs. Click Save.
This configuration can also be applied during the Elastic resource creation. To make the concepts clearer, this tutorial separates the two steps.
Native metrics collection for Azure services is not fully supported yet. To learn how to collect metrics from Azure services, refer to Monitor Microsoft Azure with Elastic Agent.
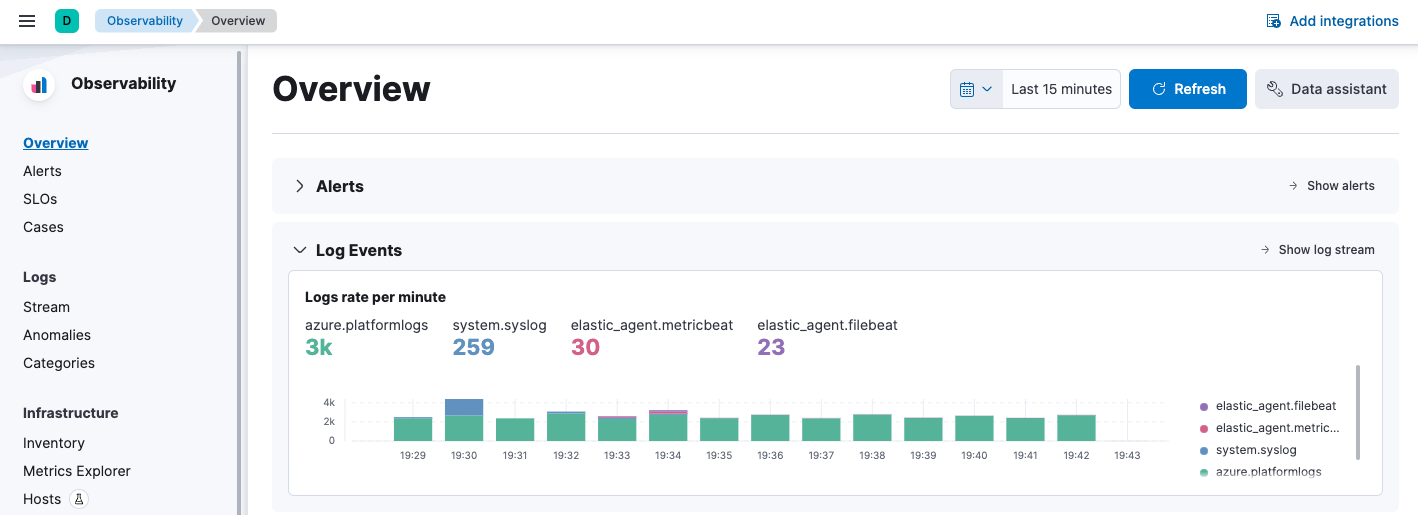
In Kibana, under Observability, click Overview until data appears in Kibana. This might take several minutes.
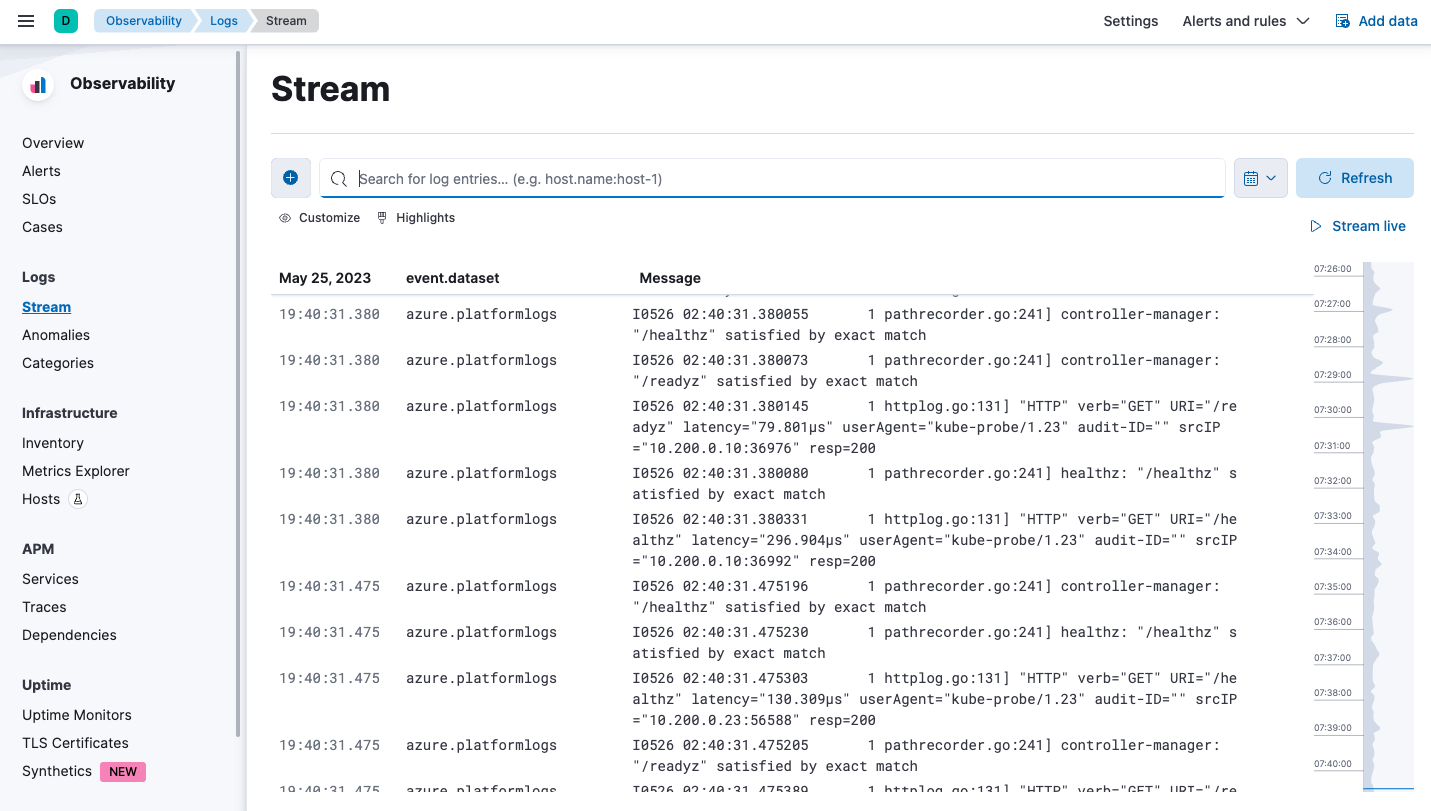
To analyze your subscription and resource logs, click Show log stream (or click Stream in the navigation pane).
Step 3: Ingest logs and metrics from your virtual machines (VMs)edit
- In the Azure portal, go to your Elasticsearch resource and click Virtual machines.
Select the VMs that you want to collect logs and metrics from, click Install Extension, and then click OK.
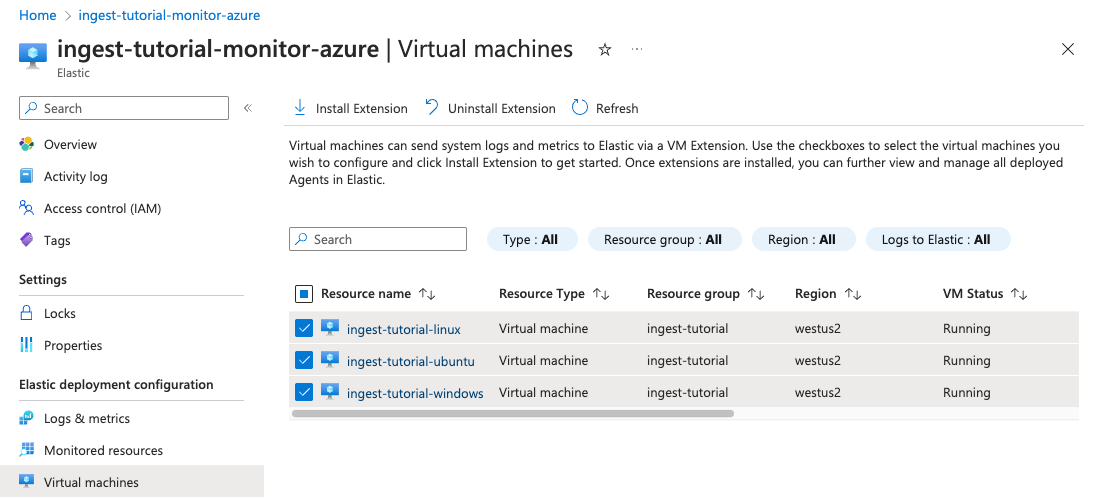
- Wait until the extension is installed and sending data (if the list does not update, click Refresh ).
Back in Kibana, view the log stream again (Logs → Stream). Notice that you can filter the view to show logs for a specific instance, for example
cloud.instance.name : "ingest-tutorial-linux":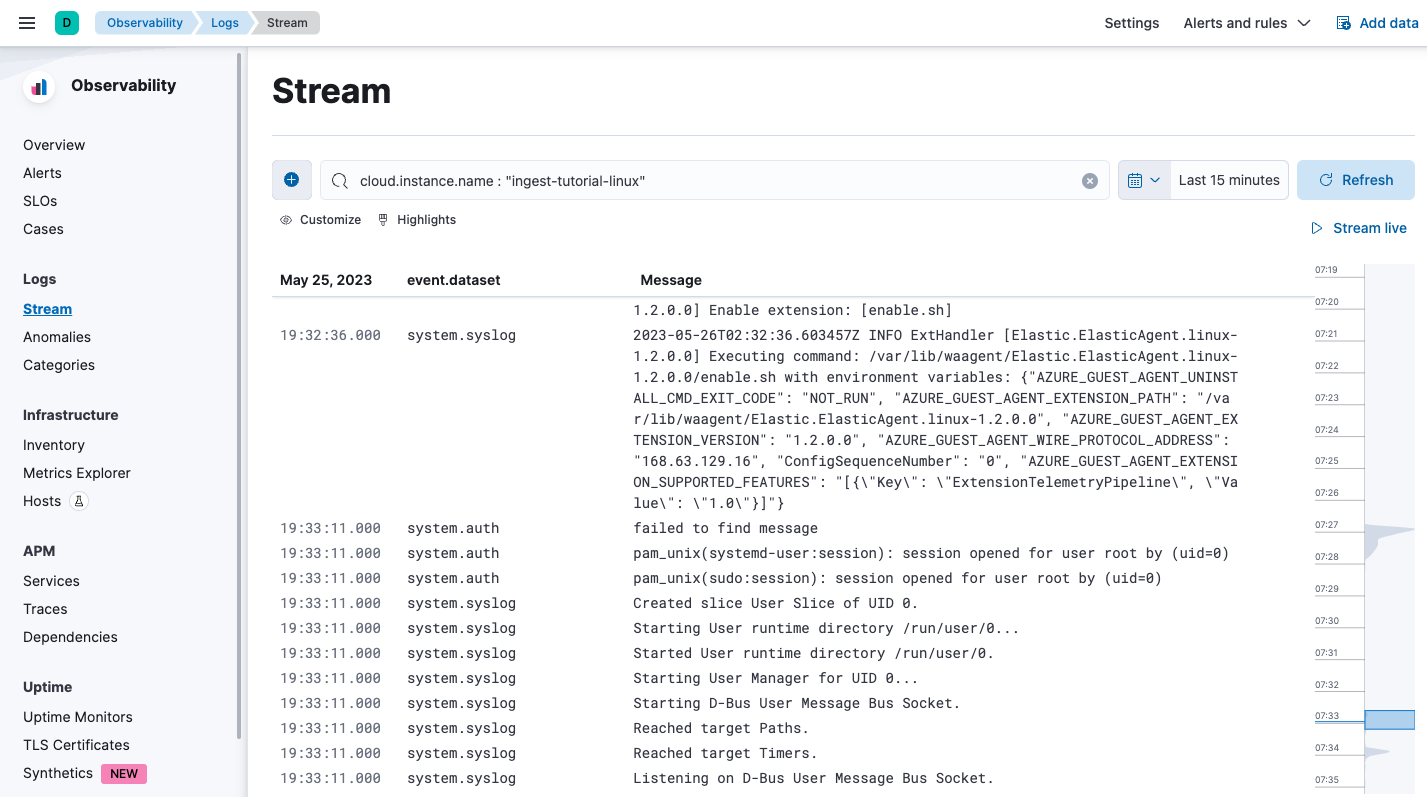
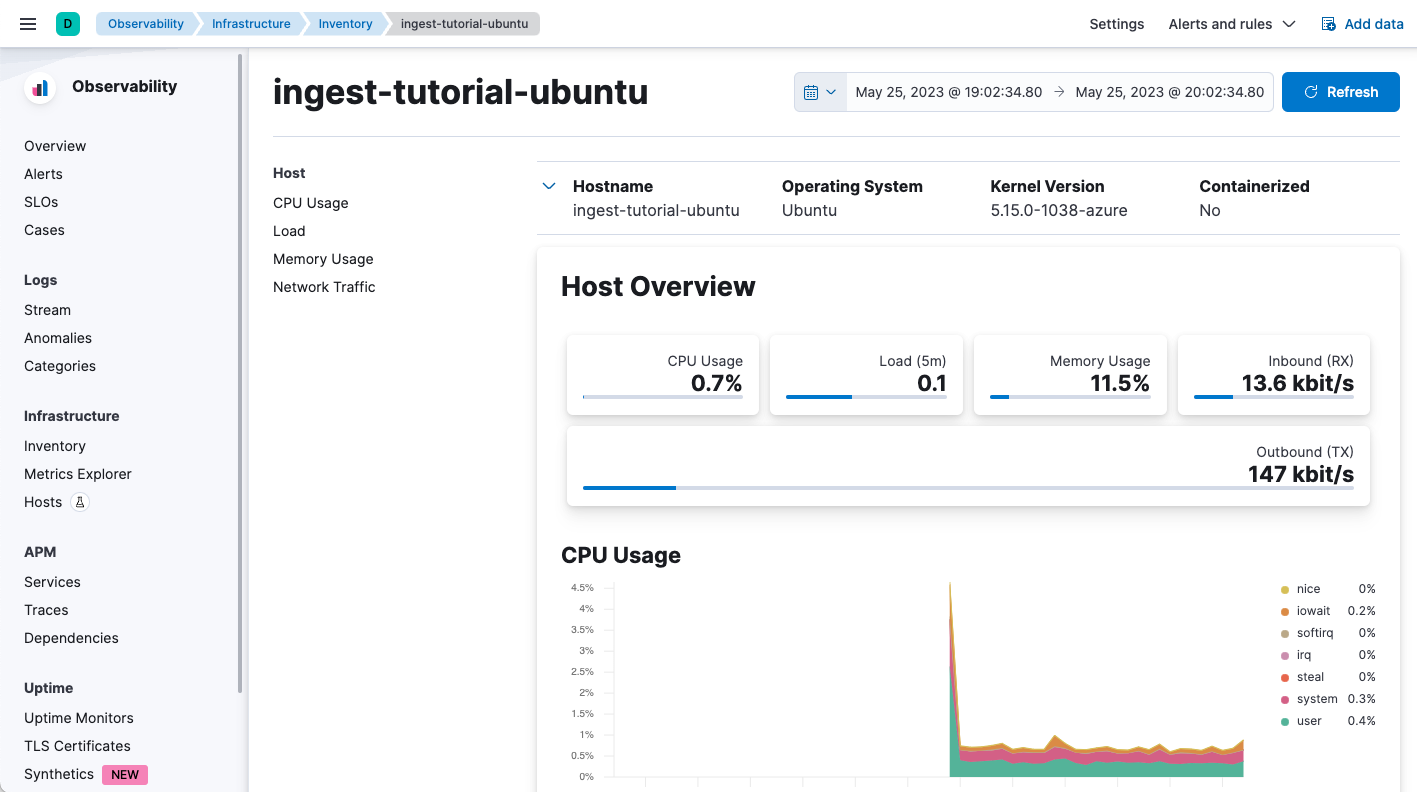
To view VM metrics, go to Infrastructure → Inventory and then select a VM.
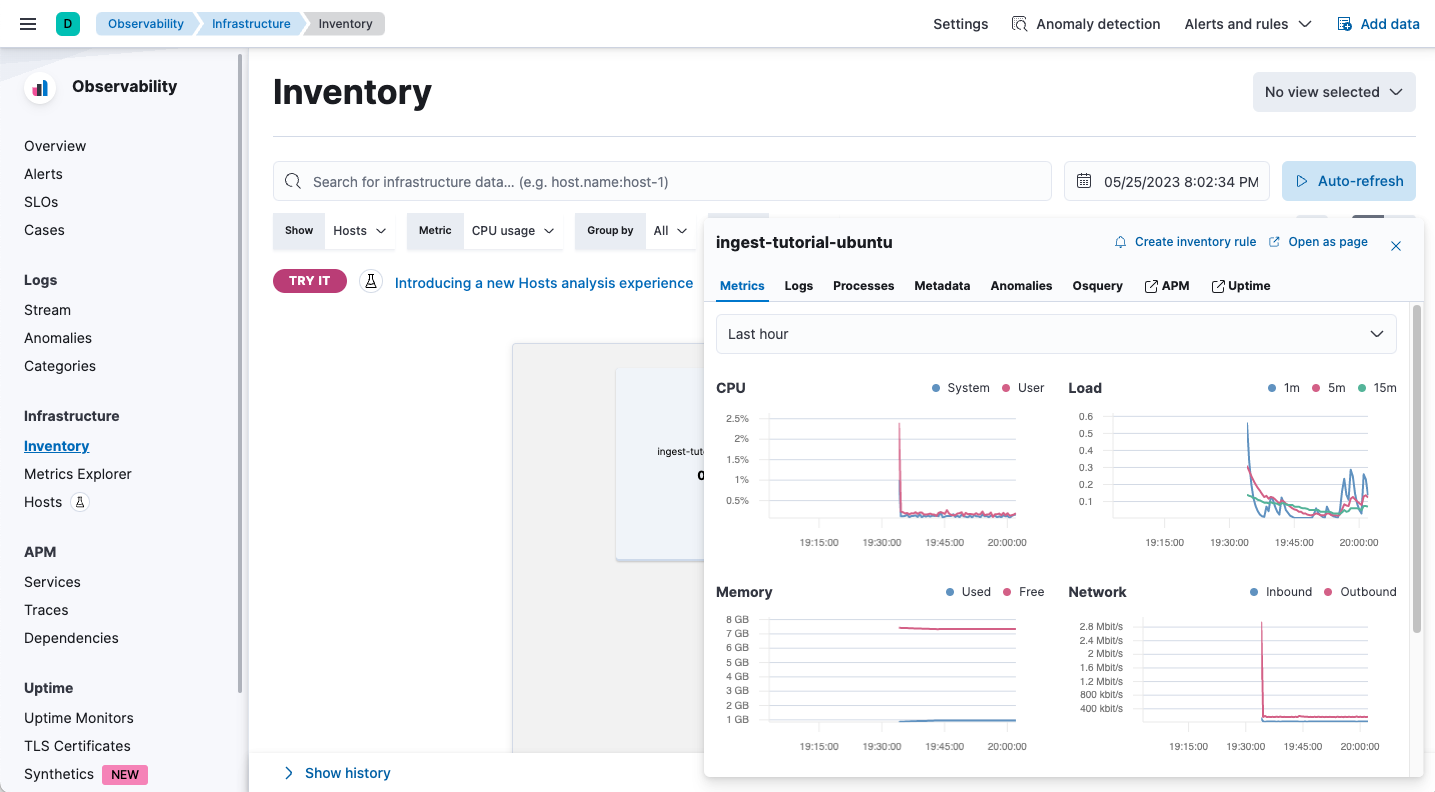
To explore the data further, click Open as page.
No comments:
Post a Comment