Get started with Q# programs and Visual Studio Code
In this article you will find the steps to use VC Code to create and submit Q#, Jupyter Notebook, or Python quantum computing jobs to Azure Quantum using VS Code.
Submitting Q# jobs to Azure Quantum
Learn how to use VS Code to run, debug, and submit a Q# program to Azure Quantum.
Prerequisites
For installation details, see Installing the Modern QDK on VS Code.
- An Azure Quantum workspace in your Azure subscription. To create a workspace, see Create an Azure Quantum workspace.
- The latest version of Visual Studio Code or open VS Code on the Web.
- The latest version of the Azure Quantum Development Kit extension.
Load a Q# sample program
In VS Code, select File > New Text File and save the file as RandomNum.qs.
Open RandomNum.qs and type
sample, then select Random Bit sample from the list of options and save the file.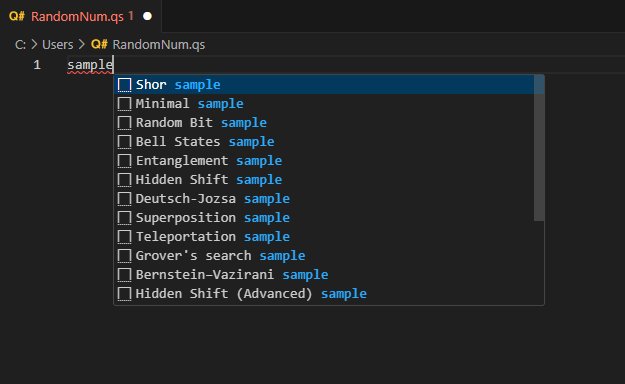
Note
You can also open your own Q# file. If you run an older Q# program and run into errors, see Testing and debugging or Migrating your programs to the Modern QDK.
Run a Q# program
To test run your program locally on the built-in simulator, click on Run from the list of commands below
@EntryPoint(), or press Ctrl+F5. Your output will appear in the debug console.To debug your program before submitting it to Azure Quantum, click on Debug from the list of commands below
@EntryPoint(), or press F5. Use the debugging controls at the top to step over, into, and out of the code. For more information about debugging Q# programs, see Testing and debugging.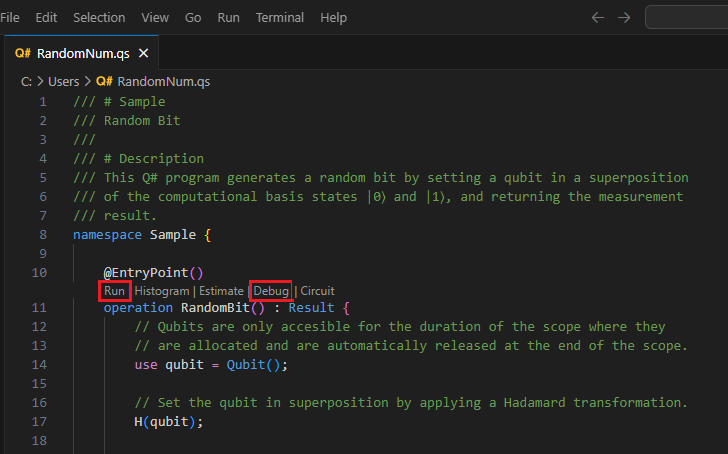
Visualize the frequency histogram
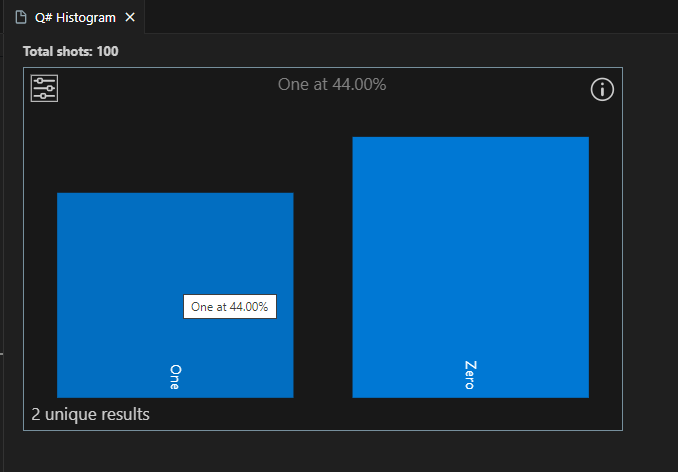
The frequency histogram represents the distribution of results obtained from running a quantum program multiple times, or "shots". Each bar in the histogram corresponds to a possible outcome, and its height represents the number of times that outcome is observed. The frequency histogram helps visualize the probability distribution of these outcomes.
Select View -> Command Palette and type “histogram” which should bring up the Q#: Run file and show histogram option. You can also click on Histogram from the list of commands below
@EntryPoint(). Select this option to open the Q# histogram window.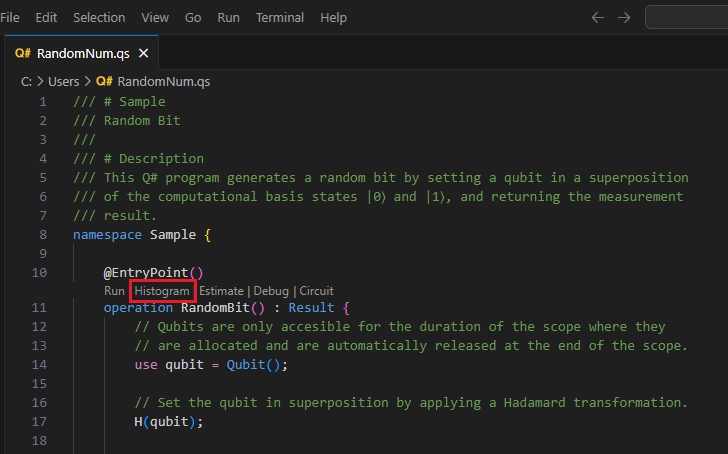
Enter a number of shots to execute the program, for example, 100 shots, and press Enter. The histogram will display in the Q# histogram window.
Click the top-left settings icon to display options.
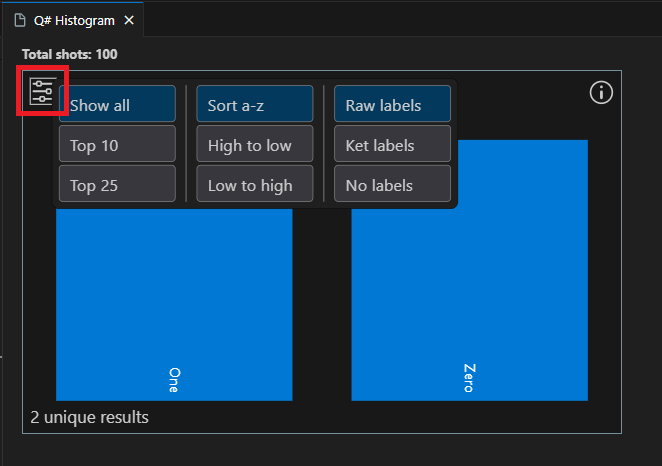
Click on a bar to display the percentage of that outcome. In this case there are two possible outcomes, 0 and 1, and the percentage of each outcome is close to 50%.
Tip
You can zoom the histogram using the mouse scroll wheel or a trackpad gesture. When zoomed in, you can pan the chart by pressing 'Alt' while scrolling.
Visualize the quantum circuit
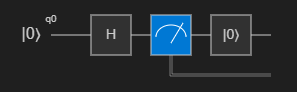
Quantum circuit diagrams are a visual representation of quantum operations. They show the flow of qubits through the quantum program, including the gates and measurements applied to them. For more information, see Quantum circuit diagrams in Visual Studio Code.
Select View -> Command Palette and type “circuit” which should bring up the Q#: Show circuit option. You can also click on Circuit from the list of commands below
@EntryPoint().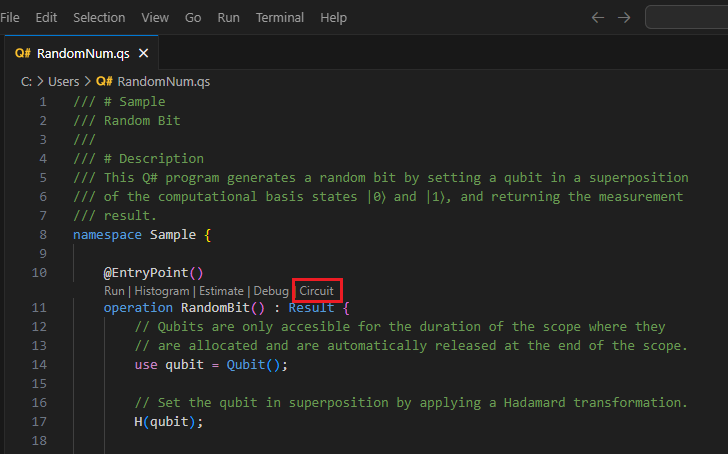
The circuit is displayed in the Q# circuit window. The circuit diagram shows one qubit register which it's initialized to the |0⟩ state. Then, a Hadamard gate, H, is applied to the qubit, followed by a measurement operation, which is represented by a meter symbol. For more information, see Quantum circuits conventions.
Connect to Azure Quantum and submit your job
You can connect and submit jobs directly from VS Code. For this example, you'll submit a job to the Rigetti simulator.
Select View -> Command Palette and type Q#: Connect to an Azure Quantum workspace. Press Enter.
Select Azure account, and follow the prompts to connect to your preferred directory, subscription, and workspace.
Note
If you have a connection string, you can select Connection string and paste the connection string corresponding to your Azure Quantum workspace. For more information, see Connect to a Quantum workspace using a connection string.
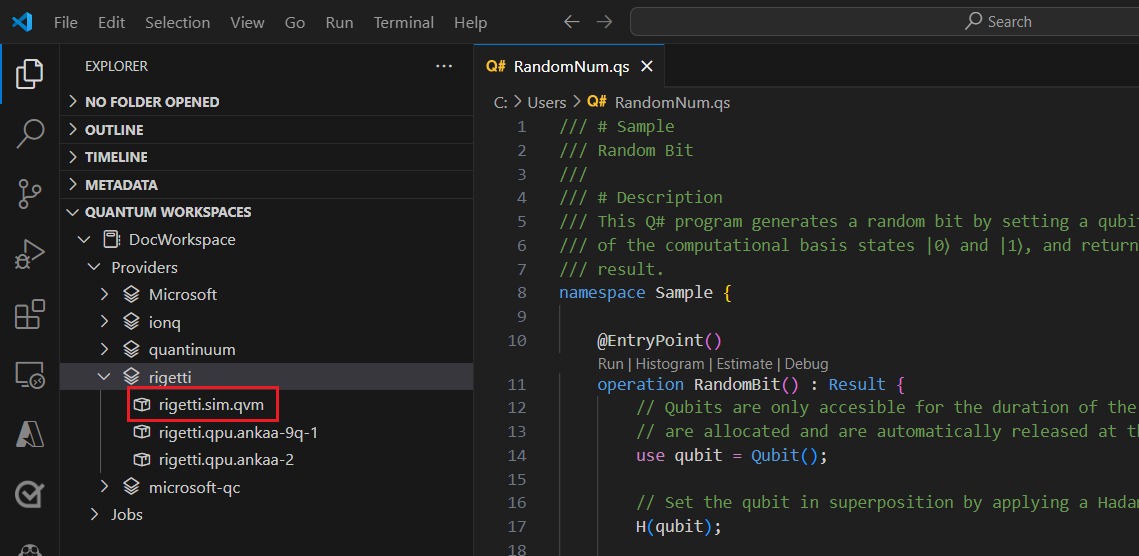
Once you are connected, in the Explorer pane, expand Quantum Workspaces.
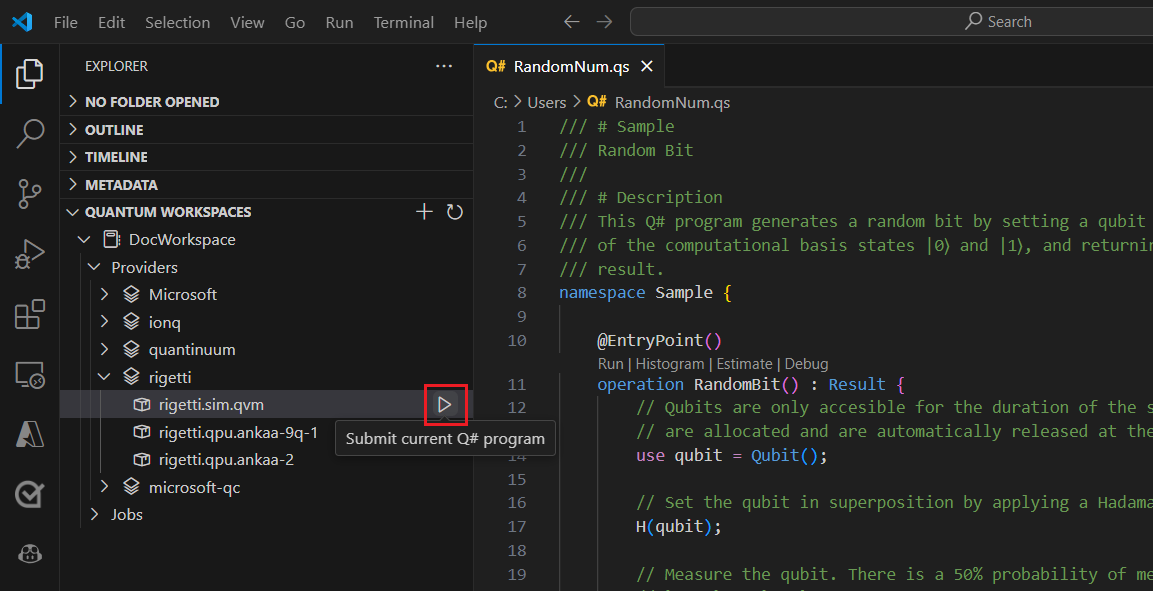
Expand your workspace and expand the Rigetti provider.
Note
If there is an issue connecting to Azure Quantum, a warning icon displays next to the workspace name. Hover over the workspace name to display error information.
Select rigetti.sim.qvm as your target.
Select the play icon to the right of the target name to start submitting the current Q# program. If you get a popup, select Change the QIR target profile and continue.
Add a name to identify the job.
Add the number of shots, or number of times that the program is run.
Press Enter to submit the job. The job status will display at the bottom of the screen.
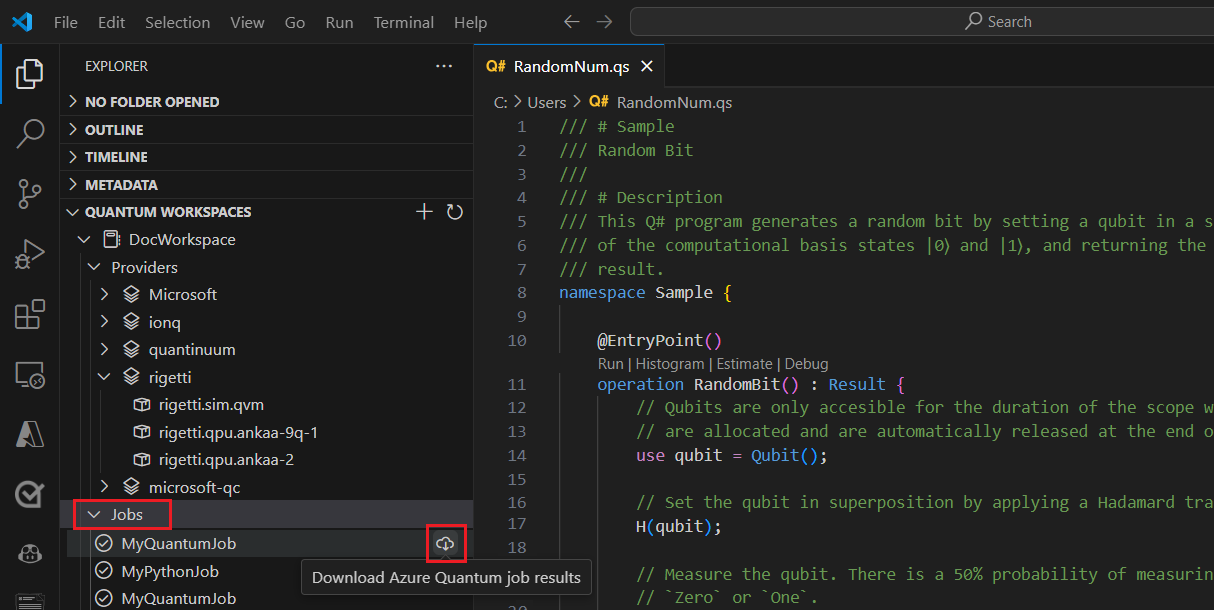
Expand Jobs and hover over your job, which displays the times and status of your job.
To view the results, select the cloud icon next to the job name to download the results from your workspace storage and display it in VS Code.
No comments:
Post a Comment