Deploying Docker Images To Azure Container Apps
1. Once you’re in the configuration settings, you must fill in the following details that have a red asterisk.
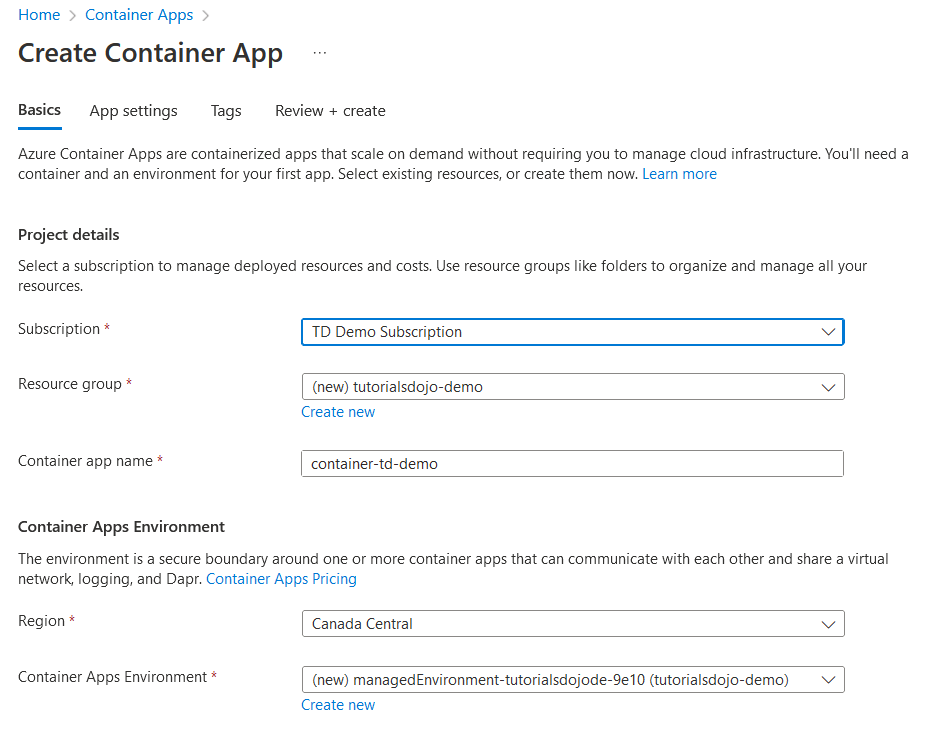
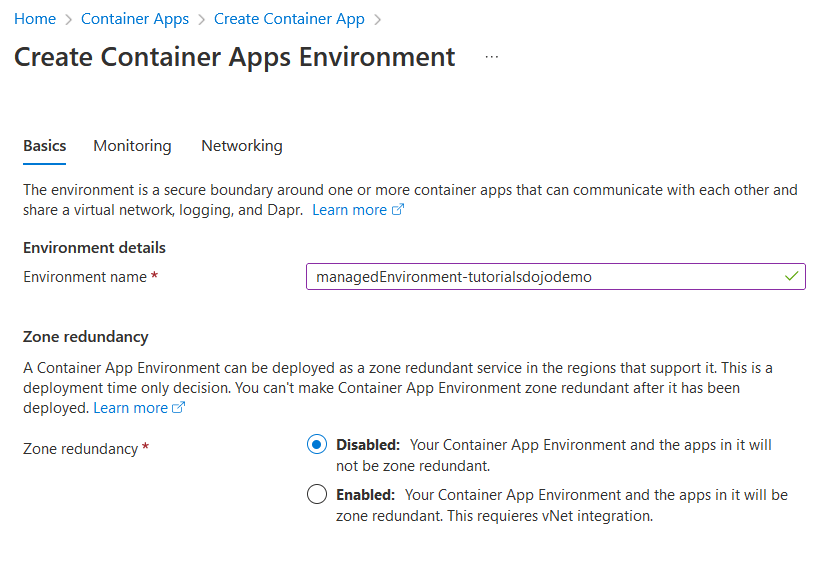
2. The Container Apps Environment field will be created automatically by default, but you can also configure it based on your needs. When you click Create new, you’ll be taken to the Create Container Apps Environment page, which includes the following tabs:
- Basics – configure environment name and zone redundancy.
- Monitoring – create a log analytics workspace to store application logs.
- Networking – select the default or custom virtual network.
3. Next is the app settings tab; we need to untick the “Use quickstart image” to use a custom image from Docker Hub. After that, we need to select an image from Docker and the container image that we will use is Grafana.
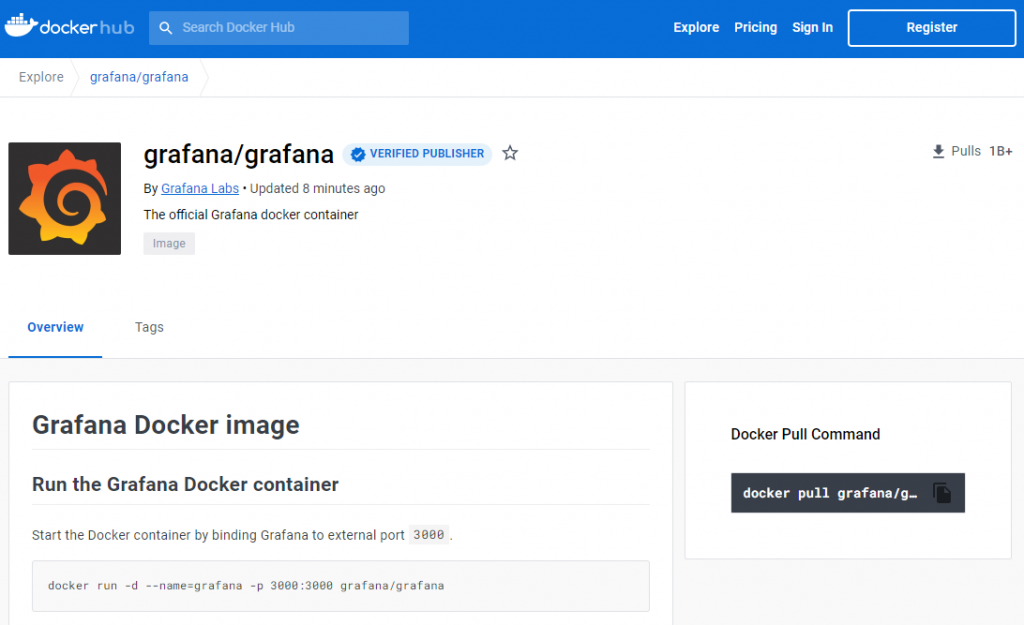
4. After you copied the Grafana image and tag, fill in the following details:
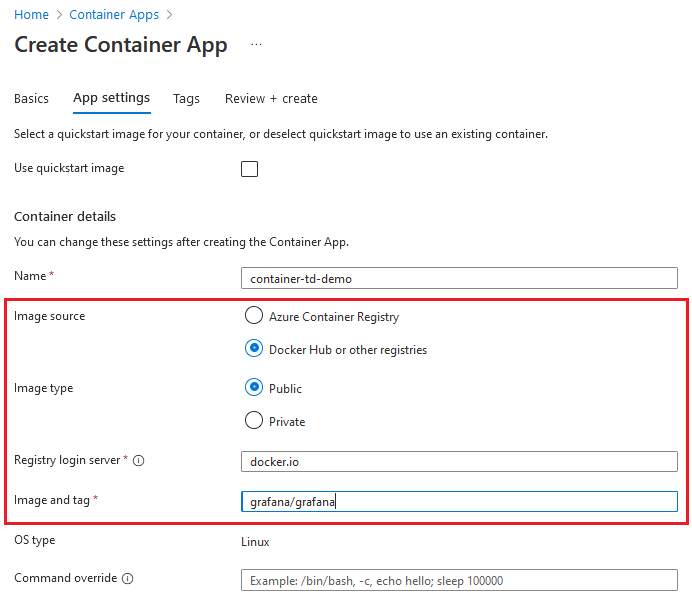
Note: If you don’t specify the image’s tag version, you’ll always get the latest version.
5. If you scroll down, you’ll see an Application ingress settings section. Don’t forget to enable the ingress, select “Accepting traffic from anywhere”, and the target port of the container. This is the port your container is listening on that will receive traffic.
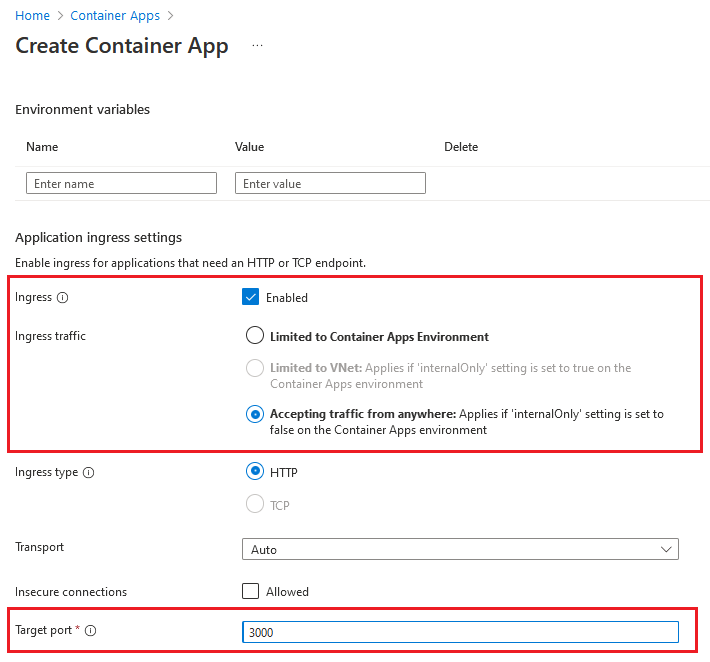
The main reason why we need to enable ingress is so we can generate an application URL. Also, the insecure connections option will just generate an HTTP URL.
6. For the tags tab, this is optional, but for best practices, Azure recommends that you should add always add tags to organize your Azure resources.
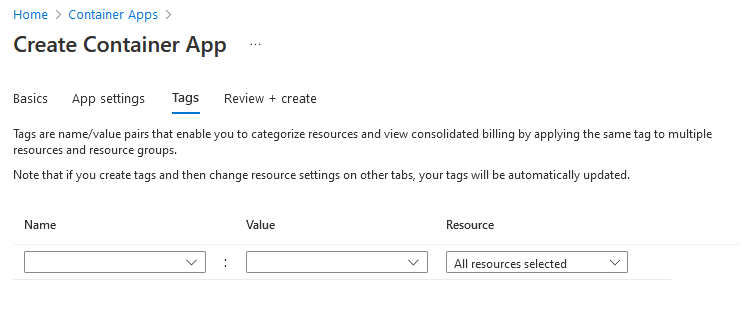
7. Before creating the container app, review all the details, and once you’re done, click Create, then, you’ll be redirected to the Deployment is in progress page. The deployment will take a few minutes to be completed.
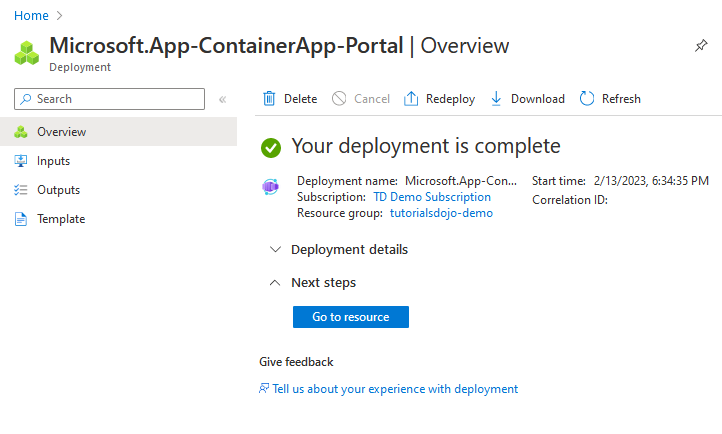
8. To verify the app that you’ve just deployed, go to resource and find the application URL.

9. After clicking the application URL, you’ll be redirected to the Grafana app container.
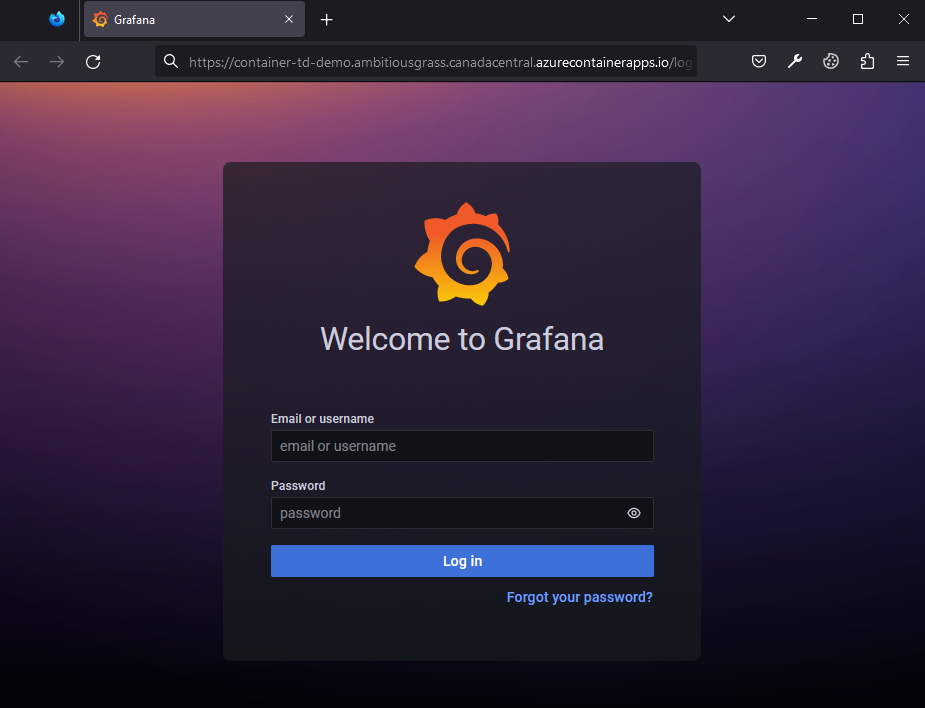
10. That’s it! Now you’ve deployed a Grafana image from Docker Hub with a few steps. Grafana is basically a dashboard to monitor the health and performance of all your resources in one platform. If you want to know about its features and how it works, then check out this article.

No comments:
Post a Comment