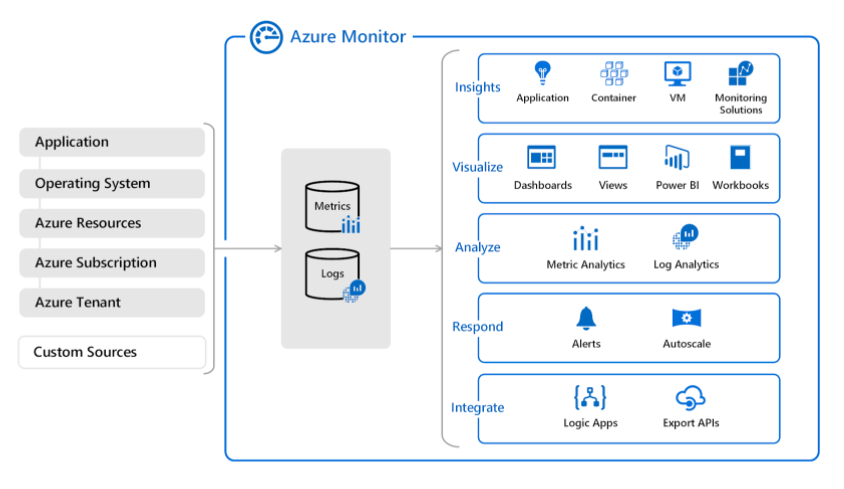
Azure Monitor
- Monitoring tool for your Azure resources and applications.
- A service to display the metrics of your resources. You can also configure alerts that send notifications when a threshold is breached.
Features
- Metrics represents a time-ordered set of data points that are published to Azure Monitor.
- The metrics collected are stored for a maximum of 93 days.
- Share your dashboards with other users using Azure Dashboards.
- The data is stored as a set of records in either the Log Analytics or Application Insights.
- You may use log analytics to collect and store the data from various log sources and use a custom query language to query them.
- Application Insights helps you detect and diagnose issues across applications and dependencies.
- When important conditions are found in your monitoring data, you can create an alert rule to identify and address issues.
- You can export basic usage metrics from your CDN endpoint with diagnostic logs.
- To connect Azure to a supported IT Service Management (ITSM) product or service, you need to use an ITSM Connector (ITSMC).
- ITSMC supports connections to the following ITMS tools: Cherwell, Provance, ServiceNow, and System Center Service Manager.
Log Analytics
- All log data obtained by Azure Monitor shall be stored in a Log Analytics workspace
- Query simple to advanced logs.
- The data is retrieved from a workspace using a log query written using Kusto Query Language (KQL).
- The queries that you can run are:
- Table-based queries – the query organizes log data into tables.
- Search queries – use this query if you need to find a specific value in your table.
- Sort and top – to display the results in a particular order, you must sort the preferred column. To get the latest records in the entire table, you can use top.
- Where – this operator allows you to add a filter to a query. You can use different expressions when writing filter conditions.
- Time filter in query – you can define a specific time range by adding the time filter to the query.
- Project and Extend – project allows you to select specific columns and extend will add additional columns.
- Summarize – you can identify a group of records and apply aggregations using the summarize operator.
- If the query includes workspaces in 20 or more regions, your query will be blocked from running.
- Log Analytics results are limited to a maximum of 10,000 records.
- With a log analytics agent, you can collect logs and performance data from virtual or physical devices outside Azure.
- Log analytics agent cannot send data to Azure Monitor Metrics, Azure Storage, or Azure Event Hubs.
Application Insights
- Enables you to monitor custom events and metrics.
- Monitor diagnostic trace logs from your application.
- You can identify performance anomalies, diagnose issues, and understand user activities in live applications.
- Monitor the performance, health, and running processes of virtual machines and virtual machines scale sets.
- You can also monitor the performance, capacity, and availability of storage accounts.
- Insights provide a comprehensive view of the performance, health, and utilization of container workloads in Azure Container Instances or clusters hosted on Azure Kubernetes Service.
- Monitor the health and metrics of all network resources.
- It provides a unified view of all Azure Key vaults’ requests, failures, operations, and latency.
- Monitor the overall performance, capacity, failures, and operational health of all Azure Cosmos DB resources and Azure Cache for Redis.
Pricing
- You pay for the ingestion and retention of data in Log Analytics (per GB/month).
- You are billed for the number of metrics you have per month.
- There are no charges for health criteria alerts.
No comments:
Post a Comment