AWS X-Ray
- AWS X-Ray analyzes and debugs production, distributed applications, such as those built using a microservices architecture. With X-Ray, you can identify performance bottlenecks, edge case errors, and other hard to detect issues.
Concepts
- A segment provides the name of the compute resources running your application logic, details about the request sent by your application, and details about the work done.
- A segment can break down the data about the work done into subsegments. A subsegment can contain additional details about a call to an AWS service, an external HTTP API, or an SQL database.
- For services that don’t send their own segments, like Amazon DynamoDB, X-Ray uses subsegments to generate inferred segments and downstream nodes on the service map. This lets you see all of your downstream dependencies, even if they don’t support tracing, or are external.
- Subsegments represent your application’s view of a downstream call as a client. If the downstream service is also instrumented (like an AWS SDK client), the segment that it sends replaces the inferred segment generated from the upstream client’s subsegment.
- X-Ray uses the data that your application sends to generate a service graph. Each AWS resource that sends data to X-Ray appears as a service in the graph.
- A service graph is a JSON document that contains information about the services and resources that make up your application. The X-Ray console uses the service graph to generate a visualization or service map. Service graph data is retained for 30 days.
- Edges connect the services that work together to serve requests. Edges connect clients to your application, and your application to the downstream services and resources that it uses.
- A trace ID tracks the path of a request through your application. A trace collects all the segments generated by a single request.
- That request is typically an HTTP GET or POST request that travels through a load balancer, hits your application code, and generates downstream calls to other AWS services or external web APIs.
- To ensure efficient tracing and provide a representative sample of the requests that your application serves, the X-Ray SDK applies a sampling algorithm to determine which requests get traced.
- By default, the X-Ray SDK records the first request each second, and five percent of any additional requests.
- For advanced tracing, you can drill down to traces for individual requests, or use filter expressions to find traces related to specific paths or users.
- Groups are a collection of traces that are defined by a filter expression. Groups are identified by their name or an Amazon Resource Name, and contain a filter expression.
- Annotations are simple key-value pairs that are indexed for use with filter expressions. Use annotations to record data that you want to use to group traces.
- A segment can contain multiple annotations.
- System-defined annotations include data added to the segment by AWS services, whereas user-defined annotations are metadata added to a segment by a developer.
- Metadata are key-value pairs with values of any type, including objects and lists, but that are not indexed. Use metadata to record data you want to store in the trace but don’t need to use for searching traces.
- When an exception, error or fault occurs while your application is serving an instrumented request, the X-Ray SDK records details about the error, including the stack trace, if available.
Features
- AWS X-Ray can be used with applications running on Amazon EC2, Amazon ECS, AWS Lambda, AWS Elastic Beanstalk. You just integrate the X-Ray SDK with your application and install the X-Ray agent.
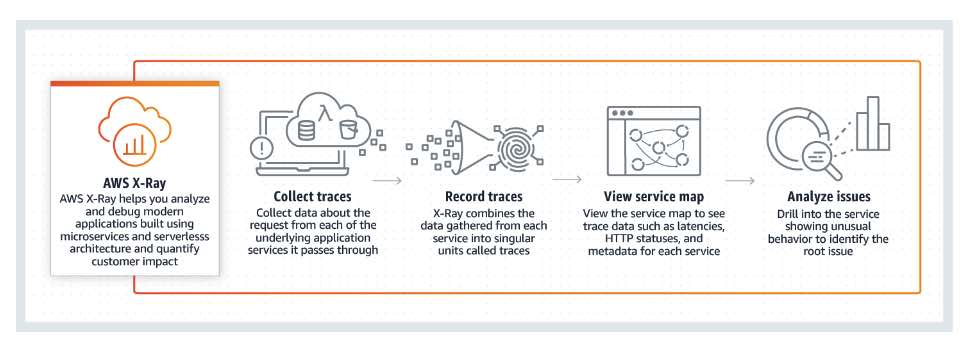
- AWS X-Ray provides an end-to-end, cross-service, application-centric view of requests flowing through your application by aggregating the data gathered from individual services in your application into a single unit called a trace.
- The X-Ray SDK captures metadata for requests made to MySQL and PostgreSQL databases (self-hosted, Amazon RDS, Amazon Aurora), and Amazon DynamoDB. It also captures metadata for requests made to Amazon SQS and Amazon SNS.
- You can set the trace sampling rate that is best suited for your production applications or applications in development. X-Ray continually traces requests made to your application and stores a sampling of the requests for your analysis.
- AWS X-Ray creates a map of services used by your application with trace data. This provides a view of connections between services in your application and aggregated data for each service, including average latency and failure rates. You can create dependency trees, perform cross-availability zone or region call detections, and more.
- AWS X-Ray lets you add annotations to data emitted from specific components or services in your application.
How X-Ray Works
- AWS X-Ray receives data from services as segments. X-Ray then groups segments that have a common request into traces. X-Ray processes the traces to generate a service graph that provides a visual representation of your application.

- X-Ray SDK
- The X-Ray SDK provides:
- Interceptors to add to your code to trace incoming HTTP requests
- Client handlers to instrument AWS SDK clients that your application uses to call other AWS services
- An HTTP client to use to instrument calls to other internal and external HTTP web services
- AWS X-Ray supports tracing for applications that are written in Node.js, Java, and .NET.
- Instead of sending trace data directly to X-Ray, the SDK sends JSON segment documents to an X-Ray daemon process listening for UDP traffic.
- The X-Ray daemon buffers segments in a queue and uploads them to X-Ray in batches.
- AWS Service Integration and Service Graph
- You can easily integrate AWS services with AWS X-Ray. Service integration can include adding tracing headers to incoming requests, sending trace data to X-Ray, or running the X-Ray daemon.
- X-Ray uses trace data from the AWS resources that power your cloud applications to generate a detailed service graph.
- You can use the service graph to identify bottlenecks, latency spikes, and other issues to solve to improve the performance of your applications.
- There are four types of X-Ray integration:
- Active instrumentation – Samples and instruments incoming requests.
- Passive instrumentation – Instrument requests that have been sampled by another service.
- Request tracing – Adds a tracing header to all incoming requests and propagates it downstream.
- Tooling – Runs the X-Ray daemon to receive segments from the X-Ray SDK.
- The following services provide X-Ray integration:
- AWS Lambda – Active and passive instrumentation of incoming requests on all runtimes. AWS Lambda adds two nodes to your service map, one for the AWS Lambda service, and one for the function.
- Amazon API Gateway – Active and passive instrumentation. API Gateway uses sampling rules to determine which requests to record, and adds a node for the gateway stage to your service map.
- Elastic Load Balancing – Request tracing on application load balancers. The application load balancer adds the trace ID to the request header before sending it to a target group.
- AWS Elastic Beanstalk – Tooling.
Pricing
- You pay based on the number of traces recorded, retrieved, and scanned. A trace represents a request to your application and may include multiple data points, such as for calls to other services and database access.
- The maximum size of a trace is 500 KB.
- Trace data is retained for 30 days from the time it is recorded at no additional cost.


No comments:
Post a Comment