What is Continuous Monitoring?
Continuous monitoring is a process to detect, report, respond all the attacks which occur in its infrastructure. Once the application is deployed into the server, the role of continuous monitoring comes in to play. The entire process is all about taking care of the company's infrastructure and respond appropriately.
In this tutorial, you will learn:
- What is Continuous Monitoring?
- What is Nagios?
- Why We Need Nagios?
- History of Nagios
- Features of Nagios
- Nagios Architecture
- Install Nagios at AWS
- Application of Nagios
- Disadvantages of Using Nagios
What is Nagios?
Nagio is a free to use open source software tool for continuous monitoring. It helps you to monitor system, network, and infrastructure. It is used for continuous monitoring of systems, applications, service and business process in a DevOps culture.
Nagios runs plugins stored on the same server. It plugin's connects with a host or another server on your network or the Internet. Therefore, in the case of failure Nagios core can alert the technical staff about the issues. So that, your technical team performs the recovery process before outage in the business processes.
Why We Need Nagios?
Here, are Important reasons to use Nagios monitoring tool are:
- Detects all types of network or server issues
- Helps you to find the root cause of the problem which allows you to get the permanent solution to the problem
- Active monitoring of your entire infrastructure and business processes
- Allows you to monitors and troubleshoot server performance issues
- Helps you to plan for infrastructure upgrades before outdated systems create failures
- You can maintain the security and availability of the service
- Automatically fix problems in a panic situation
History of Nagios
1996-Ethan Galstad uses the ideas and architecture of his earlier work to begin building a new application which runs under Linux OS
1999-The plugins that were which were originally distributed as a part of the NetSaint distribution are soon as a separate Nagios Plugins project
2002- Ethan renames the project to "Nagios" because of trademark issues with the name "NetSaint."
2005- Nagios becomes SourceForge.net Project of the Month in June
2009-Nagios Enterprises releases its first commercial version, Nagios XI
2012-Nagios again renamed as Nagios Core
2016-Nagios core surpasses 7,500,000 downloads directly from SourceForge.net website
Features of Nagios
Following are the important features of Nagios:
- Relatively scalable, Manageable, and Secure
- Good log and database system
- Informative and attractive web interfaces
- Automatically send alerts if condition changes
- If the services are running fine, then there is no need to do check that host is an alive
- Helps you to detect network errors or server crashes
- You can troubleshoot the performance issues of the server.
- The issues, if any, can be fixed automatically as they are identified during the monitoring process
- You can monitor the entire business process and IT infrastructure with a single pass
- The product's architecture is easy writing new plugins in the language of your choice
- Nagios allows you to read its configuration from an entire directory which helps you to decide how to define individual files
- Utilizes topology to determine dependencies
- Monitor network services like HTTP, SMTP, HTTP, SNMP, FTP, SSH, POP, etc.
- Helps you to define network host hierarchy using parent hosts
- Ability to define event handlers which runs during service or host events for proactive problem resolution
- Support for implementing redundant monitoring hosts
Nagios Architecture
Nagios is a client-server architecture. Usually, on a network, a Nagios server is running on a host, and plugins are running on all the remote hosts which should be monitored.
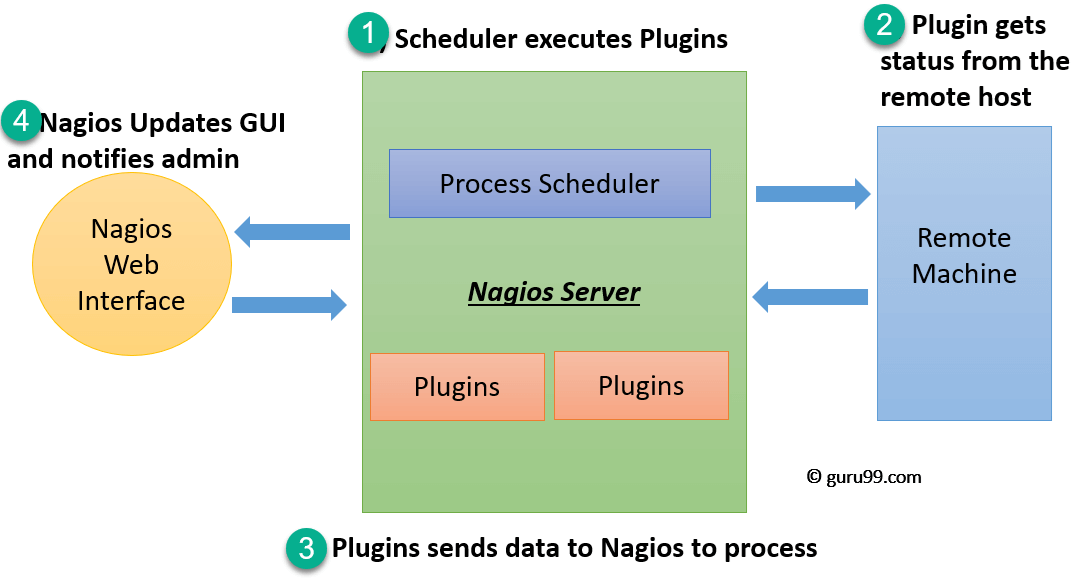
- The scheduler is a component of server part of Nagios. It sends a signal to execute the plugins at the remote host.
- The plugin gets the status from the remote host
- The plugin sends the data to the process scheduler
- The process scheduler updates the GUI and notifications are sent to admins
Plugins:
Nagios plugins provide low-level intelligence on how to monitor anything and everything with Nagios Core. Plugins operate acts as a standalone application, but they are designed to be executed by Nagios Core. It connects to Apache that is controlled by CGI to display the result. Moreover, a database connected to Nagios to keep a log file.
How do plugins work?

Consider the above example-
- Check_nt is a plugin to monitor a windows machine which is mostly available in the monitoring server
- NSClinet++ should be installed in every Windows machine that you wants to monitor
- There is an SSL connection between the server and the host which continuously exchange information with each other
Likewise, NRPE(Nagios Remote plug-in Executor) and NSCA plugins are used to monitor Linux and Mac OS X respectively.
GUI:
An interface of Nagios is used to display in web pages generated by CGI. It can be buttons to green or red, sound, graph, etc.
When the soft alert is raised many times, a hard alert is raised, then the Nagios server sends a notification to the administrator.

Install Nagios at AWS
Step 1) Got to https://aws.amazon.com/marketplace/pp/B0773T3529 and click Continue to Subscribe

Step 2) Accept Terms

Step 3) You will see subscription pending message

Step 4) Refresh the same page after a few minutes and click "Continue to Configuration

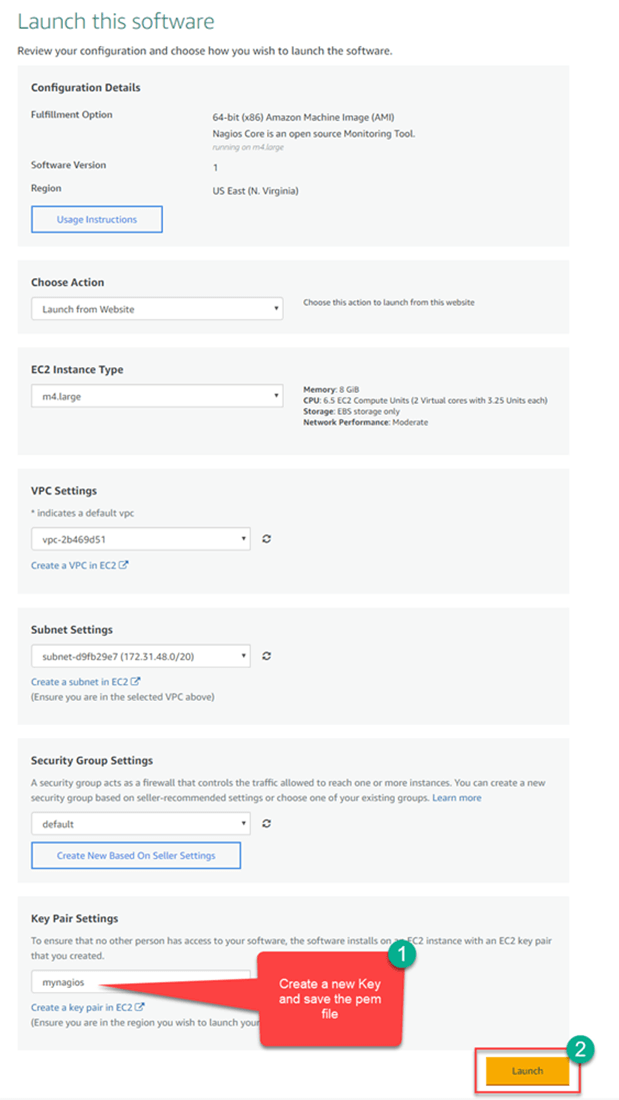
Step 5) Keep the settings default and click Continue to Launch

Step 6) Review the settings. Create a new Key and click launch
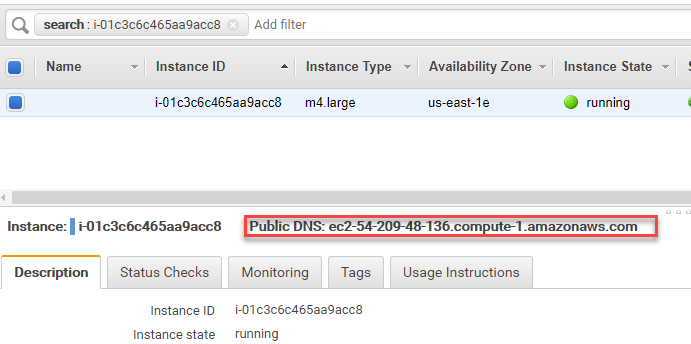
Step 7) Note the public DNS of your instance
Step 8) In your windows machine, use the tool putty generator to convert pem file to ppk

Step 9) In putty, enter the public DNS
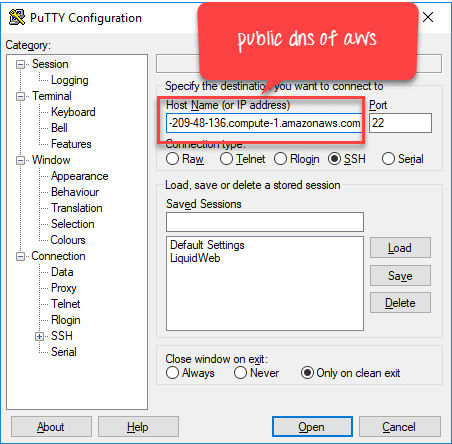
Step 10) In Auth section, enter the ppk key and click open

Step 11) In terminal,
- Enter login name as ubuntu
- Run this command sudo htpasswd -c /etc/nagios3/htpasswd.users nagiosadmin
- Enter a new password of your choice

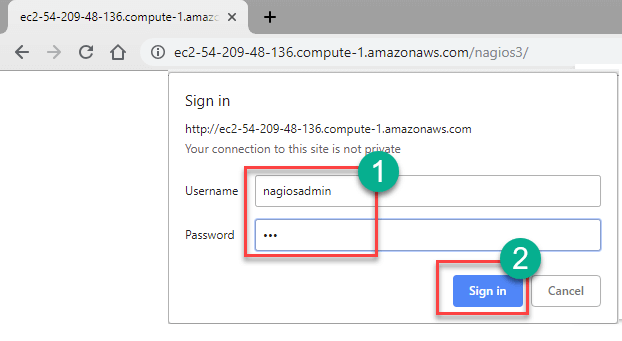
Step 12) In your browser, Go to location http://<Public DNS>/nagios3 in my case http://ec2-54-209-48-136.compute-1.amazonaws.com/nagios3/.
Enter Username: nagiosadmin
pass: set in the previous step
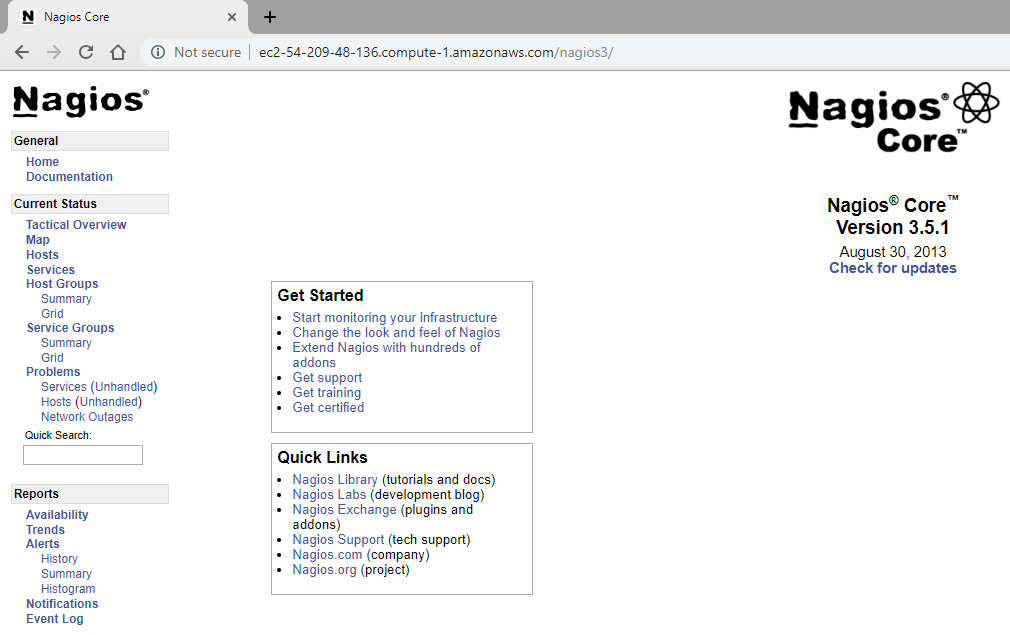
Step 13) Nagios Loads
Application of Nagios
Nagios is a health check & monitoring system for a typical Data Centre, comprises all type of equipment's such as:
- Server & Network Nodes
- Application monitoring from a single console
- Application Monitoring with transaction-level insights
- Monitor Middleware & Messaging Components
- Customizable Reports and Dashboards
- UPS Backup System
- Bio-Metric Identification System
- Temperature & Humidity Control System (Sensing Mechanism)
- CCTV/NVR System
- Storage Subsystem (NAS&SAN)
Disadvantages of Using Nagios
- Important feature like wizards or interactive dashboard are only available on Nagios XI, which is quite an expensive tool
- Nagios core has a confusing interface
- There're many configuration files which are very hard to configure for users
- Nagios can't monitor network throughput
- The tool not allows you to manage the network but only allows to monitor the network
- Nagios makes no difference between various devices like servers, routers, or switches as it treats every device as a host
Summary
- Continuous monitoring is a process to detect, report, respond all the attacks which occur in its infrastructure
- Nagio is free to use open source software tool for continuous monitoring
- Nagio offers effective monitoring of your entire infrastructure and business processes
- Ethan Galstad uses the ideas and architecture of his earlier work to begin building a new application Nagios which runs under Linux OS
- Nagios is relatively scalable, Manageable, and Secure
- Three important components of Nagios architecture are 1) Web Interface (GUI) 2)Nagios Server 3)Plugin
- Nagios allows application monitoring from a single console with transaction-level insights
- This tool not allows you to manage the network but only allows to monitor the network
No comments:
Post a Comment