Wednesday, 31 July 2024

Get started with Dynatrace

;;;;;;;;;;;;;;;;;;;;;;

In this quickstart, you create a new instance of Azure Native Dynatrace Service. You can either create a new Dynatrace environment or link to an existing Dynatrace environment.

When you use the integrated Dynatrace experience in Azure portal, the following entities are created and mapped for monitoring and billing purposes.

Flowchart showing three entities: Marketplace S A A S connecting to Dynatrace resource, connecting to Dynatrace environment.

  • Dynatrace resource in Azure - Using the Dynatrace resource, you can manage the Dynatrace environment in Azure. The resource is created in the Azure subscription and resource group that you select during the create process or linking process.
  • Dynatrace environment - The Dynatrace environment on Dynatrace Software as a Service (SaaS). When you create a new environment, the environment on Dynatrace SaaS is automatically created, in addition to the Dynatrace resource in Azure.
  • Marketplace SaaS resource - The SaaS resource is created automatically, based on the plan you select from the Dynatrace Marketplace offer. This resource is used for billing purposes.

Prerequisites

Before you link the subscription to a Dynatrace environment,complete the pre-deployment configuration..

Find Offer

Use the Azure portal to find Azure Native Dynatrace Service application.

  1. Go to the Azure portal and sign in.

  2. If you've visited the Marketplace in a recent session, select the icon from the available options. Otherwise, search for Marketplace.
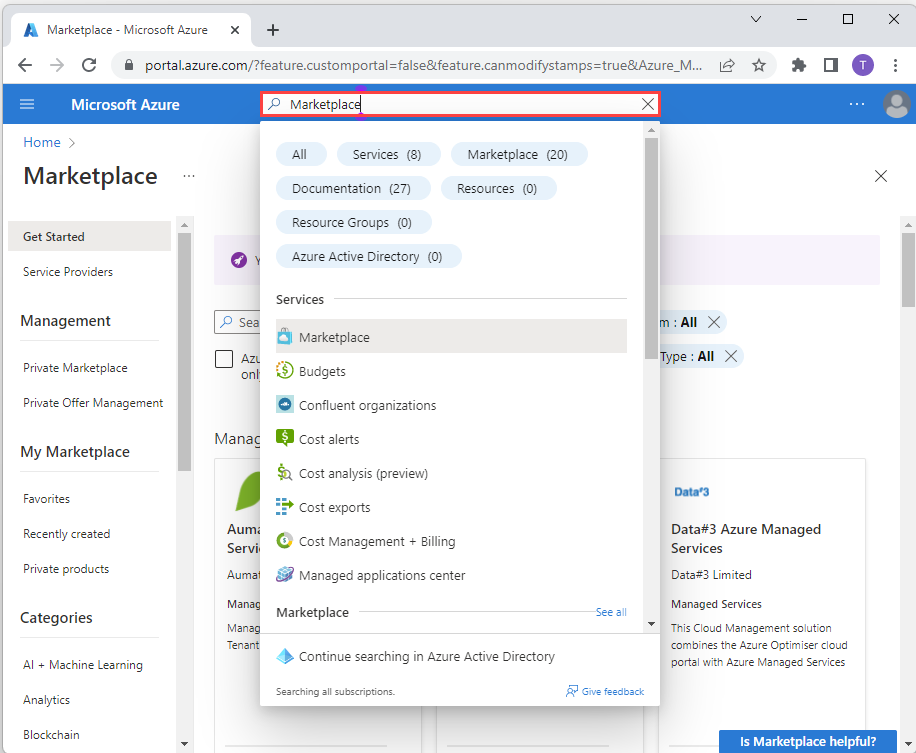
    Screenshot showing a search for Marketplace in the Azure portal.

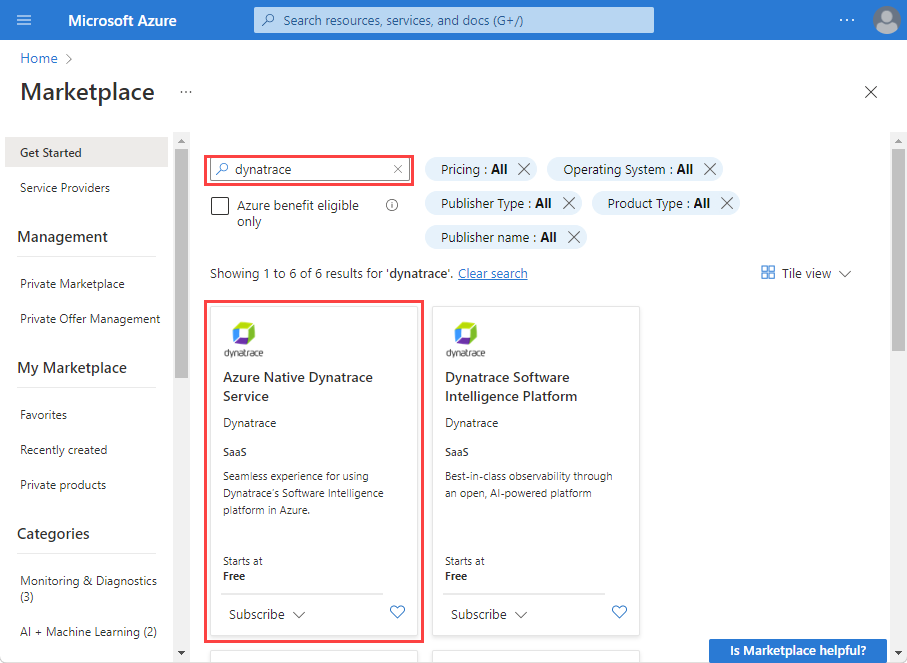
  3. In the Marketplace, search for DynatraceScreenshot showing the Azure Native Dynatrace Service offering.

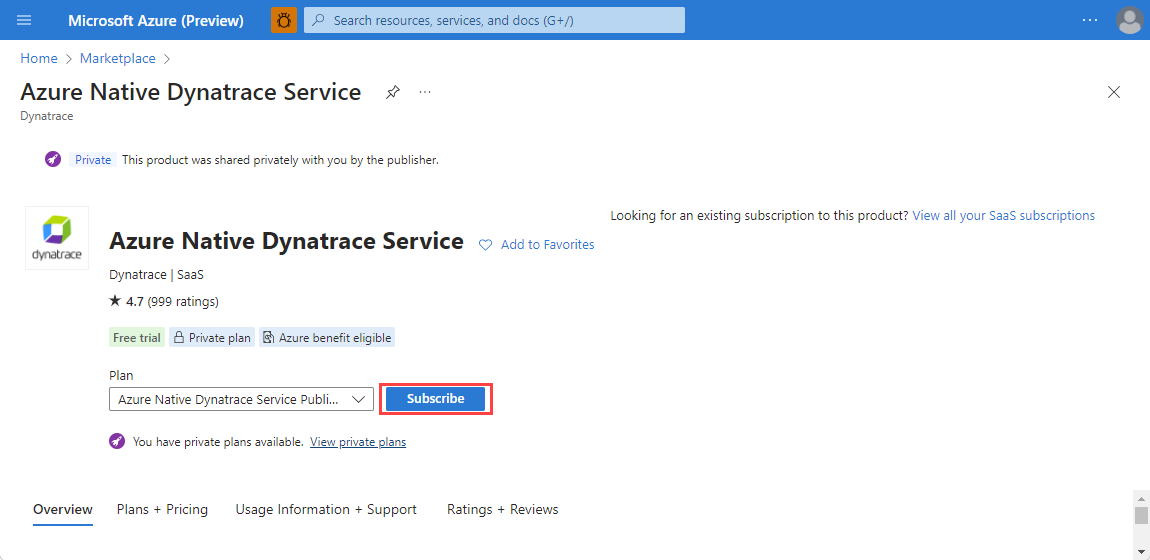
  4. Select SubscribeScreenshot showing Dynatrace in the working pane to create a subscription.

Create a Dynatrace resource in Azure

  1. When creating a Dynatrace resource, you see two options: one to create a new Dynatrace environment, and another to link Azure subscription to an existing Dynatrace environment. If you want to create a new Dynatrace environment, select Create action under the Create a new Dynatrace environment option. Screenshot showing two options: new Dynatrace or existing Dynatrace.
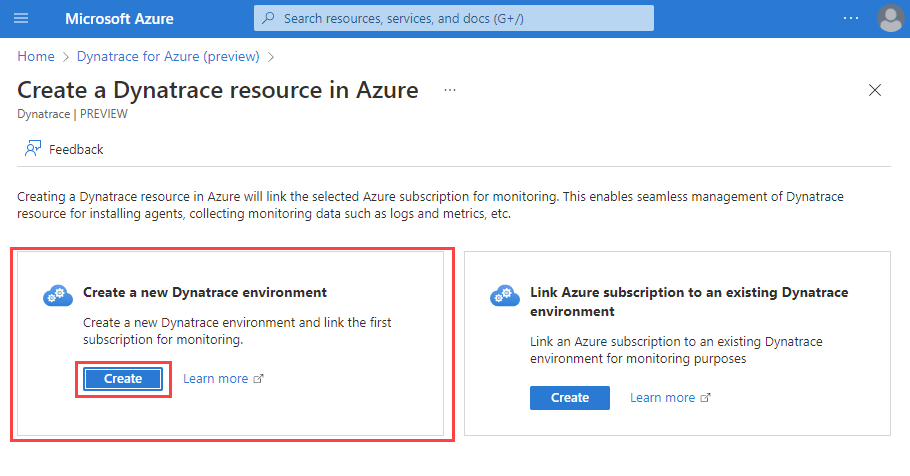
  2. You see a form to create a Dynatrace resource in the working pane.
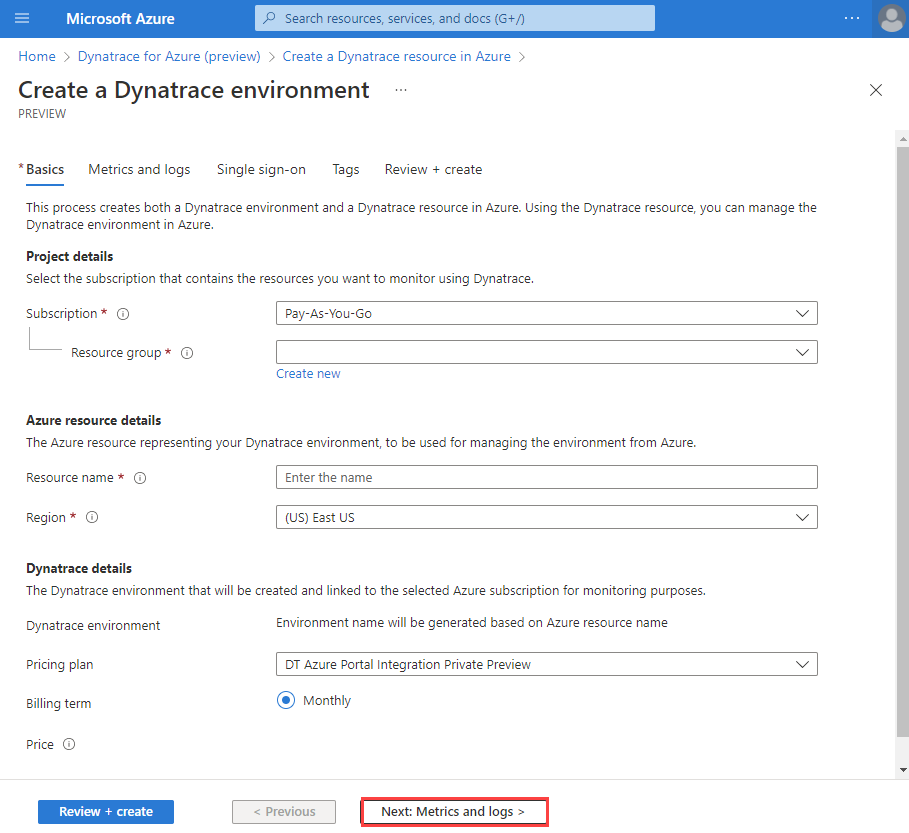
    Screenshot of basic properties needed for new Dynatrace instance.

    Provide the following values:

    PropertyDescription
    SubscriptionSelect the Azure subscription you want to use for creating the Dynatrace resource. You must have owner or contributor access.
    Resource groupSpecify whether you want to create a new resource group or use an existing one. A resource group is a container that holds related resources for an Azure solution.
    Resource nameSpecify a name for the Dynatrace resource. This name will be the friendly name of the new Dynatrace environment.
    LocationSelect the region. Select the region where the Dynatrace resource in Azure and the Dynatrace environment is created.
    Pricing planSelect from the list of available plans.
                                 
  3. Select Next: Metrics and Logs.

Configure metrics and logs

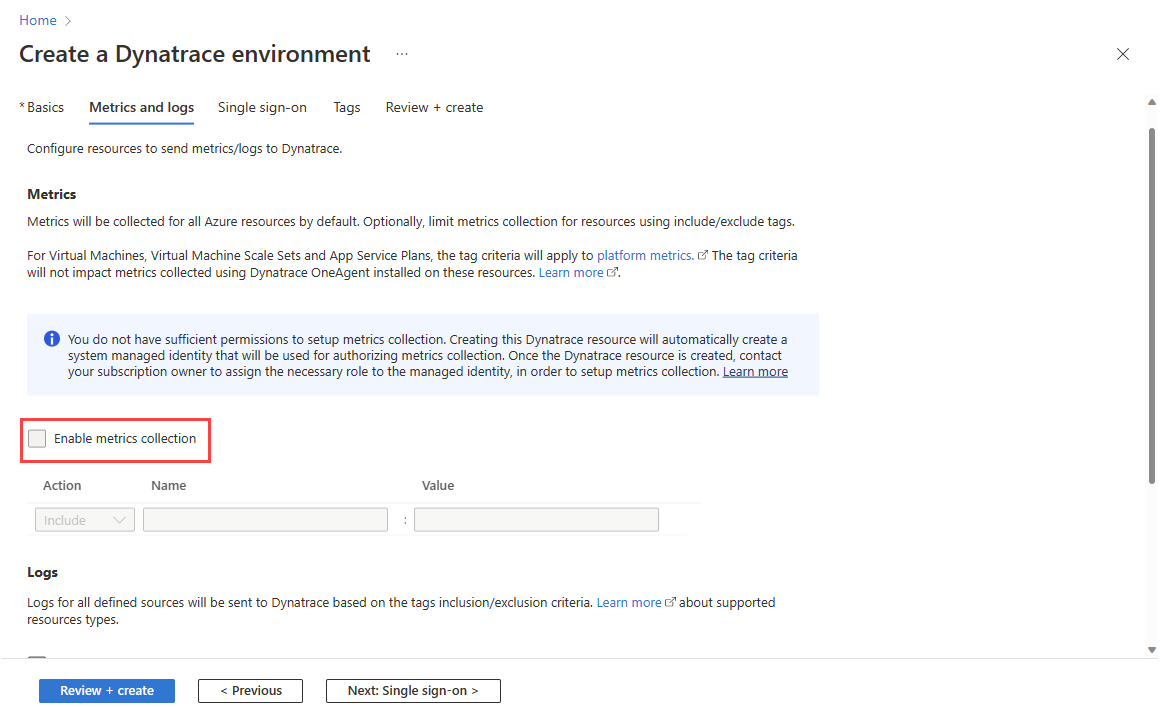
  1. Your next step is to configure metrics and logs for your resources. Azure Native Dynatrace Service supports the metrics for both compute and non-compute resources. Compute resources include VMs, app services and more. If you have an owner role in the subscription, you see the option to enable metrics collection. Screenshot showing contributor view of metrics and logs.
    • Metrics for compute resources – Users can send metrics for the compute resources, virtual machines and app services, by installing the Dynatrace OneAgent extension on the compute resources after the Dynatrace resource has been created.
    • Metrics for non-compute resources – These metrics can be collected by configuring the Dynatrace resource to automatically query Azure monitor for metrics. To enable metrics collection, select the checkbox. If you have an owner access in your subscription, you can enable and disable the metrics collection using the checkbox. Proceed to the configuring logs. However, if you have contributor access, use the information in the following step.
  2. If you have a contributor role in the subscription, you don't see the option to enable metrics collection because in Azure a contributor can't assign a monitoring reader role to a resource that is required by the metrics crawler to collect metrics.
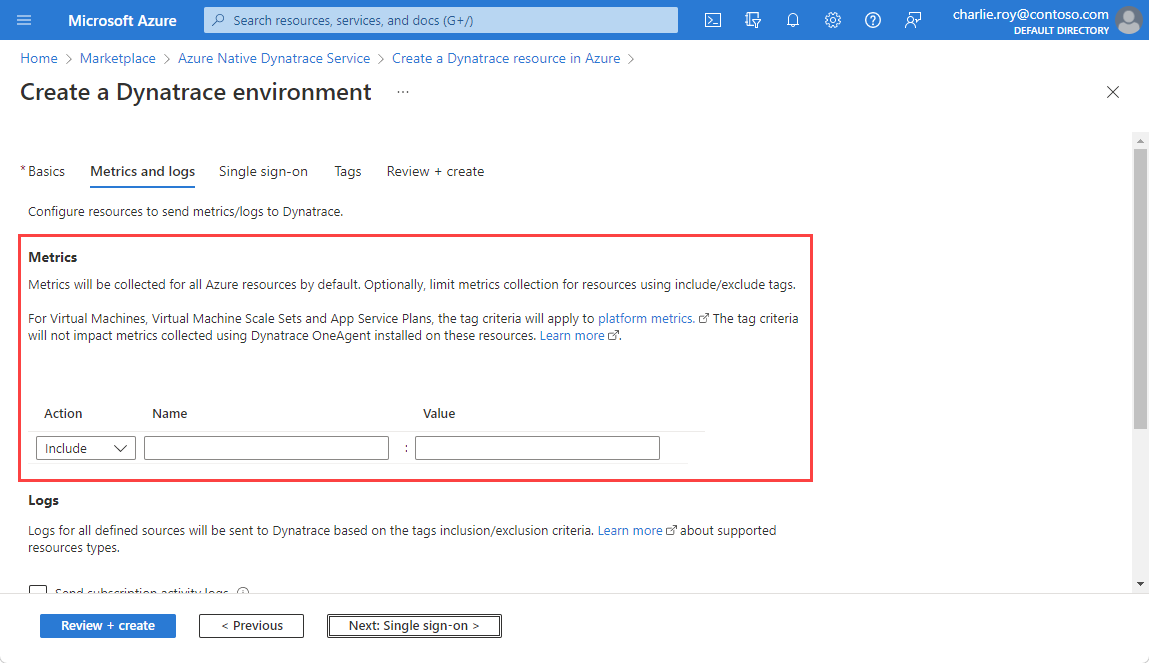
    Screenshot showing options for metrics and logs.

    Complete the resource provisioning excluding the metrics configuration and ask an owner to assign an appropriate role manually to your resource. If you have an owner role in the subscription, you can take the following steps to grant a monitoring reader identity to a contributor user:

    1. Go to the resource created by a contributor.

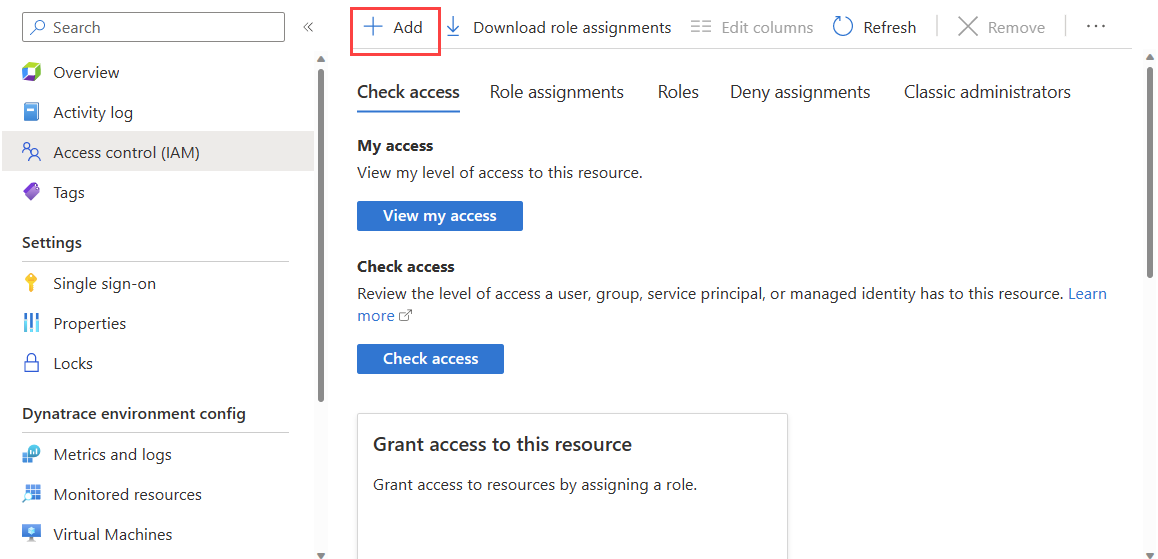
    2. Go to Access control in the resource menu on the left and select Add then Add role assignmentScreenshot showing the access control page.

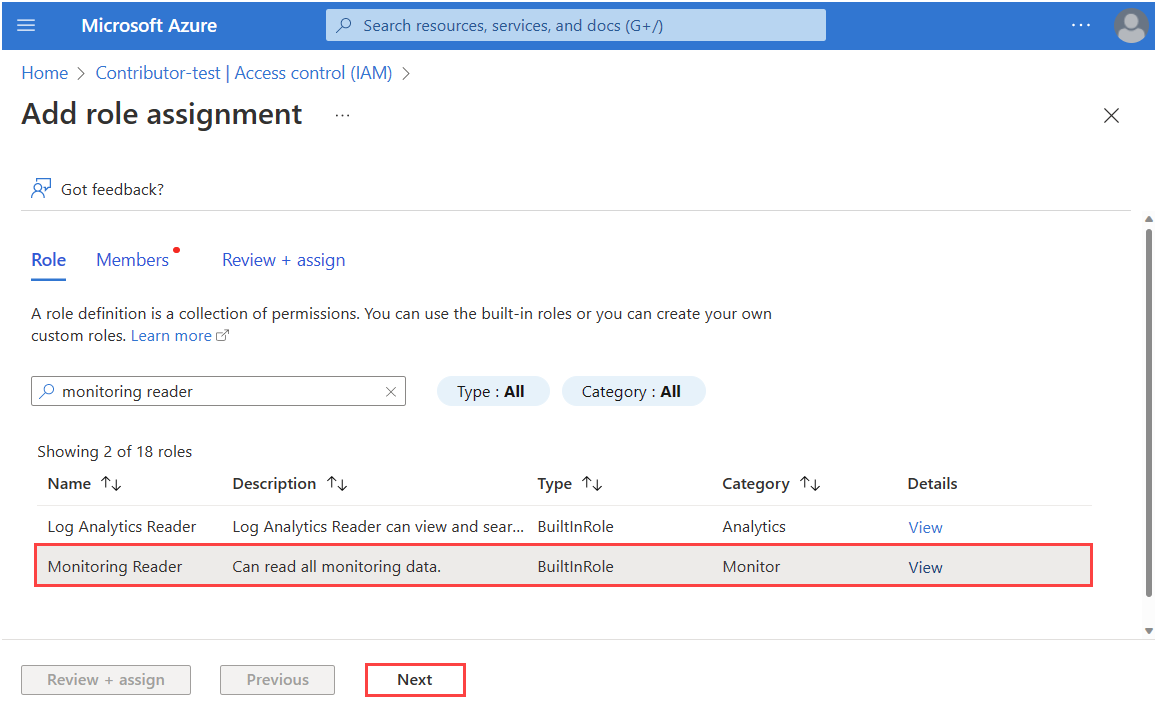
    3. In the list, scroll down and select on Monitoring reader. Then, select NextScreenshot showing the process for selecting Monitoring reader role.

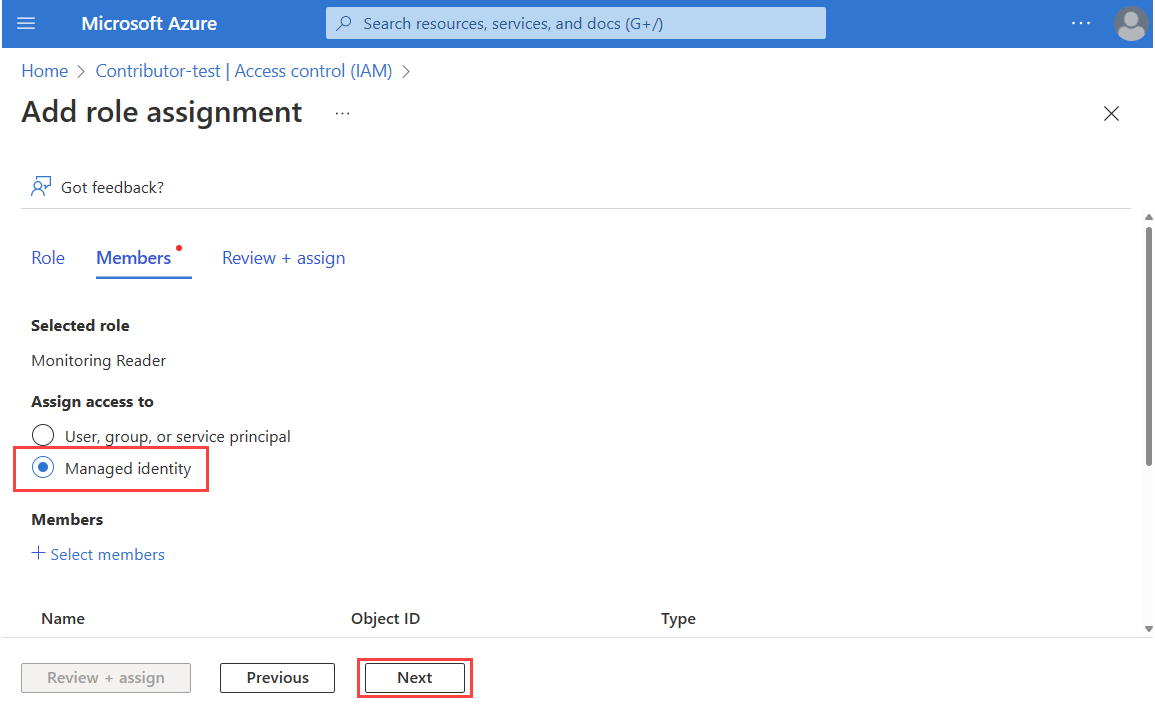
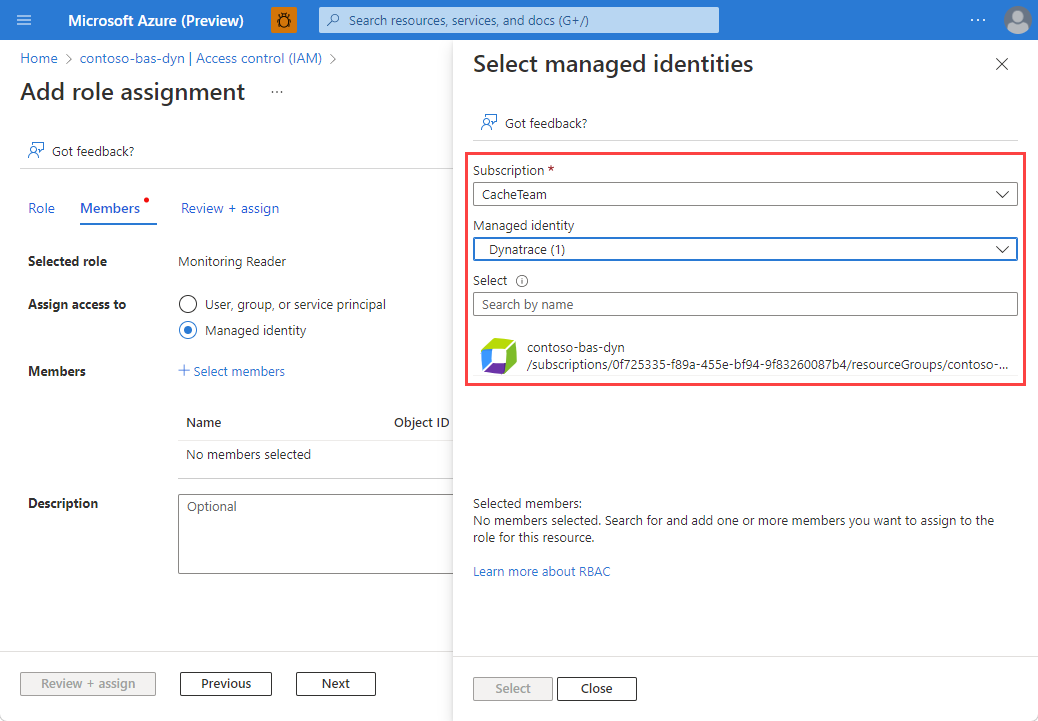
    4. In Assign access to, select Managed identity. Then, Select membersScreenshot showing the process to assign a role to a managed identity.

    5. Select the Subscription. In Managed identity, select Dynatrace and the Dynatrace resource created by the contributor. After you select the resource, use Select to continue. Screenshot showing the Dynatrace resource with a new contributor selected.
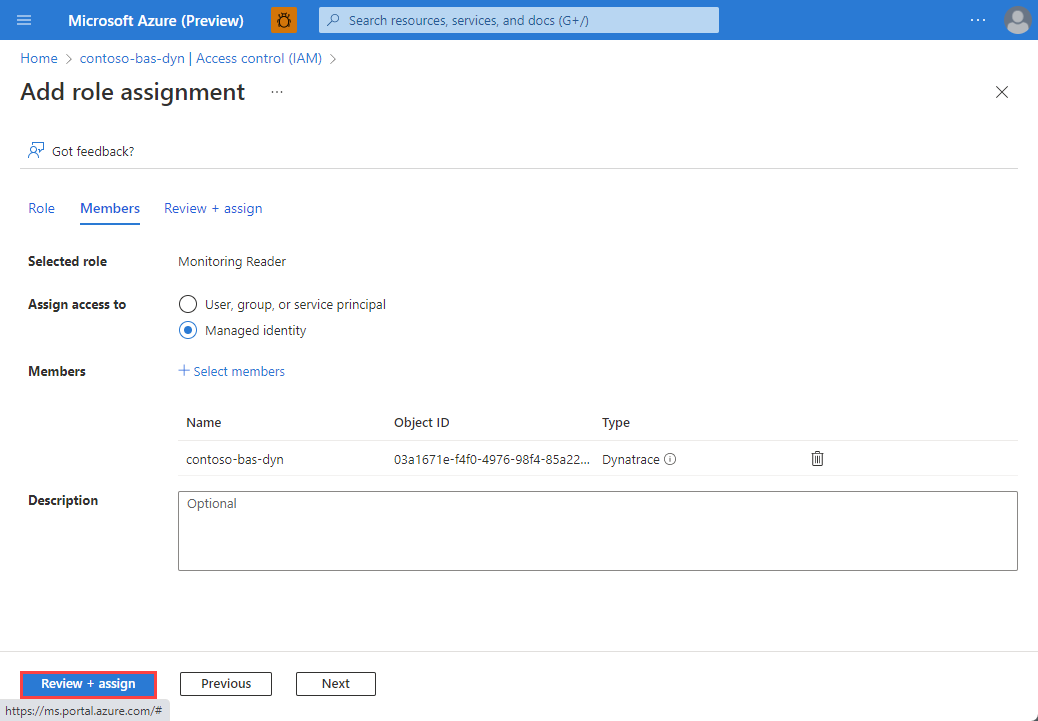
    6. When you have completed the selection, select Review + assign Screenshot showing Add role assignment working pane with Review and assign with a red box around it.
  3. When creating the Dynatrace resource, you can set up automatic log forwarding for three types of logs:

    • Send subscription activity logs - Subscription activity logs provide insight into the operations on your resources at the control plane. Updates on service-health events are also included. Use the activity log to determine the what, who, and when for any write operations (PUT, POST, DELETE). There's a single activity log for each Azure subscription.

    • Send Azure resource logs for all defined sources - Azure resource logs provide insight into operations that were taken on an Azure resource at the data plane. For example, getting a secret from a Key Vault is a data plane operation. Or, making a request to a database is also a data plane operation. The content of resource logs varies by the Azure service and resource type.

    • Send Microsoft Entra logs – Microsoft Entra logs allow you to route the audit, sign-in, and provisioning logs to Dynatrace. The details are listed in Microsoft Entra activity logs in Azure Monitor. The global administrator or security administrator for your Microsoft Entra tenant can enable Microsoft Entra logs.

  4. To send subscription level logs to Dynatrace, select Send subscription activity logs. If this option is left unchecked, none of the subscription level logs are sent to Dynatrace.

  5. To send Azure resource logs to Dynatrace, select Send Azure resource logs for all defined resources. The types of Azure resource logs are listed in Azure Monitor Resource Log categories.

    When the checkbox for Azure resource logs is selected, by default, logs are forwarded for all resources. To filter the set of Azure resources sending logs to Dynatrace, use inclusion and exclusion rules and set the Azure resource tags:

    • All Azure resources with tags defined in include Rules send logs to Dynatrace.
    • All Azure resources with tags defined in exclude rules don't send logs to Dynatrace.
    • If there's a conflict between an inclusion and exclusion rule, the exclusion rule applies.

    The logs sent to Dynatrace are charged by Azure. For more information, see the pricing of platform logs sent to Azure Marketplace partners.

  6. Once you have completed configuring metrics and logs, select Next: Single sign-on.

Configure single sign-on

  1. You can establish single sign-on to Dynatrace from the Azure portal when your organization uses Microsoft Entra ID as its identity provider. If your organization uses a different identity provider or you don't want to establish single sign-on at this time, you can skip this section.

    Screenshot showing options for single sign-on.

  2. To establish single sign-on through Microsoft Entra ID, select the checkbox for Enable single sign-on through Microsoft Entra ID.

    The Azure portal retrieves the appropriate Dynatrace application from Microsoft Entra ID. The app matches the Enterprise app you provided in an earlier step.


Get support for Elastic Cloud (Elasticsearch) - An Azure Native ISV Service


Get support for Elastic Cloud (Elasticsearch) - An Azure Native ISV Service

Contact support

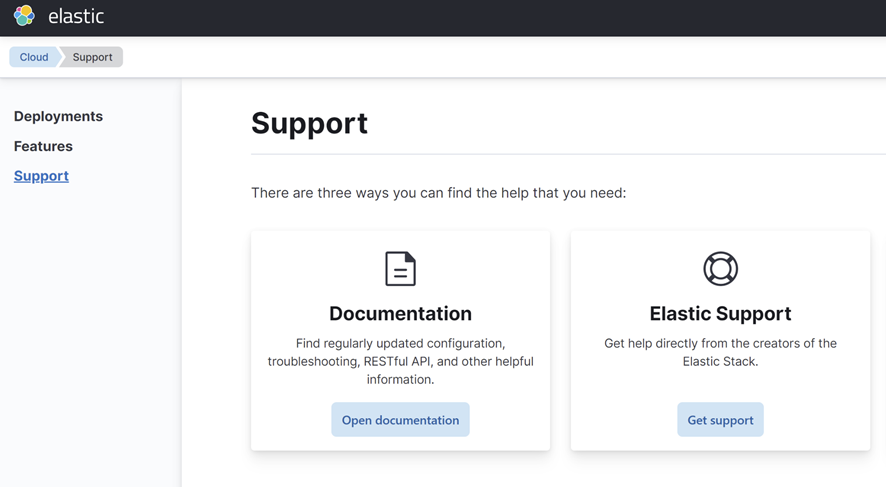
To contact support about the Elastic integration with Azure, select the New Support request in the left pane. Select Open an Elastic Support ticket.

Screenshot of opening a support ticket for the Elastic integration with Azure.

In the Elastic site, open a support request.

Screenshot of opening a support ticket on the Elastic site.

Azure Monitor Logs overview


Azure Monitor Logs overview

Azure Monitor Logs is a centralized software as a service (SaaS) platform for collecting, analyzing, and acting on telemetry data generated by Azure and non-Azure resources and applications.

You can collect logs, manage data models and costs, and consume different types of data in one Log Analytics workspace, the primary Azure Monitor Logs resource. This means you never have to move data or manage other storage, and you can retain different data types for as long or as little as you need.

This article provides an overview of how Azure Monitor Logs works and explains how it addresses the needs and skills of different personas in an organization.

Log Analytics workspace

Log Analytics workspace is a data store that holds tables into which you collect data.

To address the data storage and consumption needs of various personas who use a Log Analytics workspace, you can:

A screenshot of a Log Analytics workspace in the Azure portal.

You can also configure network isolation, replicate your workspace across regions, and design a workspace architecture based on your business needs.

Kusto Query Language (KQL) and Log Analytics

You retrieve data from a Log Analytics workspace using a Kusto Query Language (KQL) query, which is a read-only request to process data and return results. KQL is a powerful tool that can analyze millions of records quickly. Use KQL to explore your logs, transform and aggregate data, discover patterns, identify anomalies and outliers, and more.

Log Analytics is a tool in the Azure portal for running log queries and analyzing their results. Log Analytics Simple mode lets any user, regardless of their knowledge of KQL, retrieve data from one or more tables with one click. A set of controls lets you explore and analyze the retrieved data using the most popular Azure Monitor Logs functionality in an intuitive, spreadsheet-like experience.

Screenshot that shows Log Analytics Simple mode.

Users who are familiar with KQL can use Log Analytics KQL mode to edit and create queries, which they can then use in Azure Monitor features such as alerts and workbooks, or share with other users.

For a description of Log Analytics, see Overview of Log Analytics in Azure Monitor. For a walkthrough of using Log Analytics features to create a simple log query and analyze its results, see Log Analytics tutorial.

Built-in insights and custom dashboards, workbooks, and reports

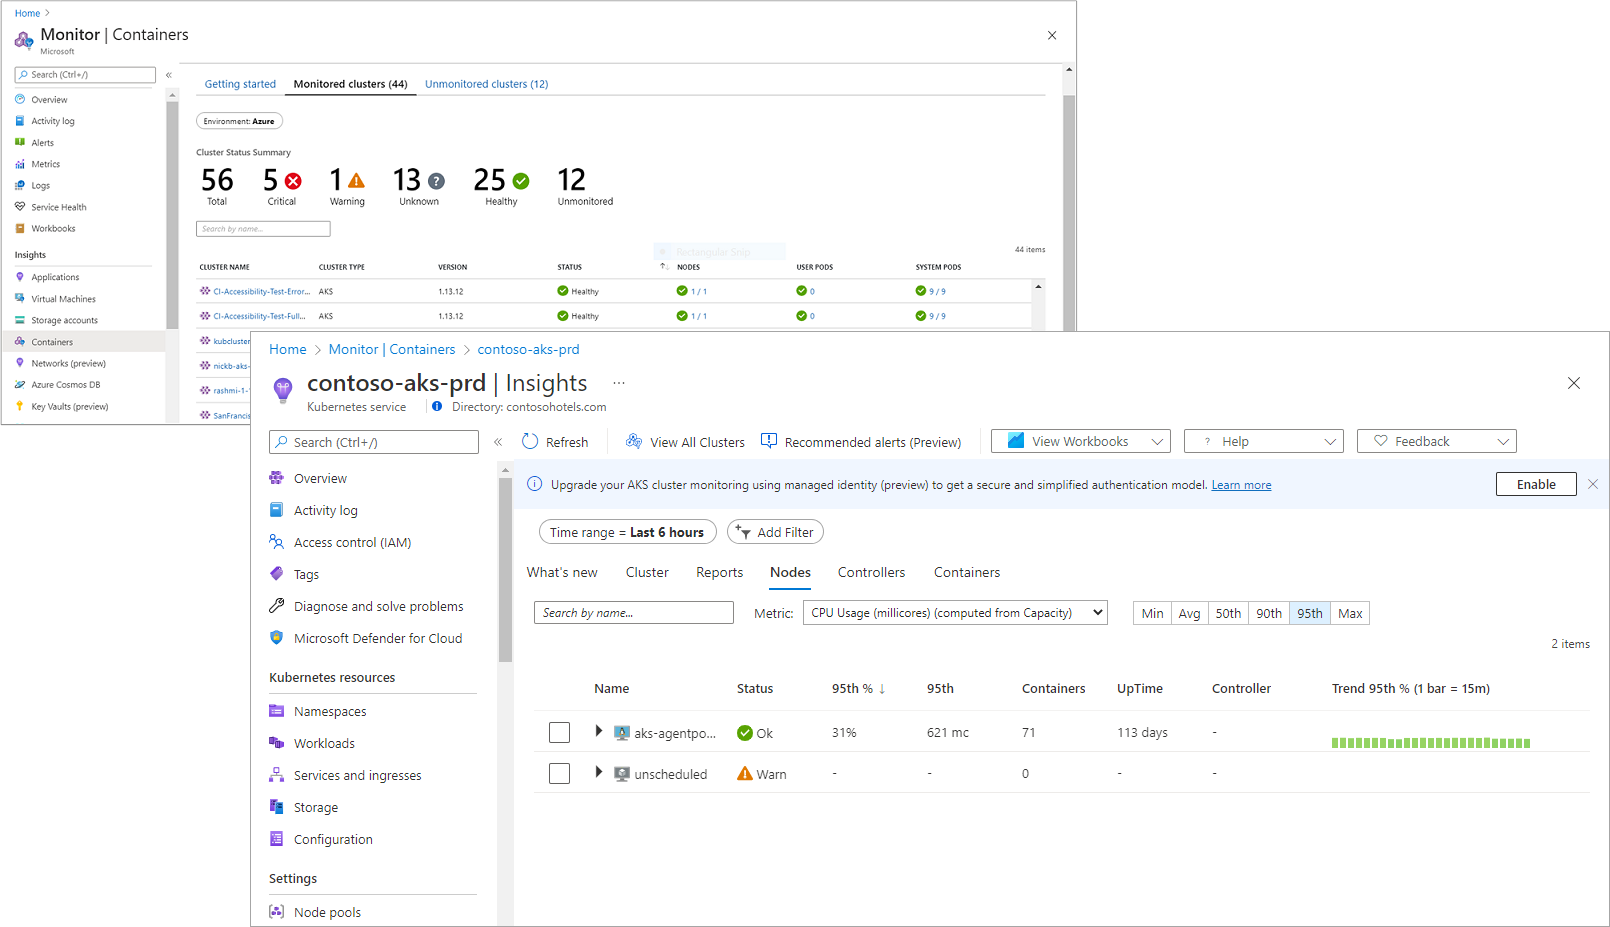
Many of Azure Monitor's ready-to-use, curated Insights experiences store data in Azure Monitor Logs, and present this data in an intuitive way so you can monitor the performance and availability of your cloud and hybrid applications and their supporting components.

A screenshot that shows the built-in Container Insights monitoring experience in Azure Monitor.

You can also create your own visualizations and reports using workbooks, dashboards, and Power BI.

Table plans

You can use one Log Analytics workspace to store any type of log required for any purpose. For example:

  • High-volume, verbose data that requires cheap long-term storage for audit and compliance
  • App and resource data for troubleshooting by developers
  • Key event and performance data for scaling and alerting to ensure ongoing operational excellence and security
  • Aggregated long-term data trends for advanced analytics and machine learning

Table plans let you manage data costs based on how often you use the data in a table and the type of analysis you need the data for.

The diagram and table below compare the Analytics, Basic, and Auxiliary table plans. For information about interactive and long-term retention, see Manage data retention in a Log Analytics workspace. For information about how to select or modify a table plan, see Select a table plan.

Diagram that presents an overview of the capabilities provided by the Analytics, Basic, and Auxiliary table plans.

FeaturesAnalyticsBasicAuxiliary (Preview)
Best forHigh-value data used for continuous monitoring, real-time detection, and performance analytics.Medium-touch data needed for troubleshooting and incident response.Low-touch data, such as verbose logs, and data required for auditing and compliance.
Supported table typesAll table typesAzure tables that support Basic logs and DCR-based custom tablesDCR-based custom tables
Log queriesFull query capabilities.Full Kusto Query Language (KQL) on a single table, which you can extend with data from an Analytics table using lookup.Full KQL on a single table, which you can extend with data from an Analytics table using lookup.
Query performanceFastFastSlower
Good for auditing. Not optimized for real-time analysis.
Alerts
Insights
Dashboards✅ Cost per query for dashboard refreshes not included.Possible, but slow to refresh, cost per query for dashboard refreshes not included.
Data export
Microsoft Sentinel
Search jobs
Summary rules✅ KQL limited to a single table✅ KQL limited to a single table
Restore
Query price included
Ingestion costStandardReducedMinimal
Interactive retention30 days (90 days for Microsoft Sentinel and Application Insights).
Can be extended to up to two years at a prorated monthly long-term retention charge.
30 days30 days
Total retentionUp to 12 yearsUp to 12 yearsUp to 12 years*
*Public preview limitation: Auxiliary plan total retention is currently fixed at 365 days.


Data collection

To collect data from a resource to your Log Analytics workspace:

  1. Set up the relevant data collection tool based on the table below.
  2. Decide which data you need to collect from the resource.
  3. Use transformations to remove sensitive data, enrich data or perform calculations, and filter out data you don't need, to reduce costs.

This table lists the tools Azure Monitor provides for collecting data from various resource types

Resource typeData collection toolCollected data
AzureDiagnostic settingsAzure tenant - Microsoft Entra audit logs provide sign-in activity history and audit trail of changes made within a tenant.
Azure resources - Logs and performance counters.
Azure subscription - Service health records along with records on any configuration changes made to the resources in your Azure subscription.
ApplicationApplication insightsApplication performance monitoring data.
ContainerContainer insightsContainer performance data.
Virtual machineData collection rulesMonitoring data from the guest operating system of Azure and non-Azure virtual machines.
Non-Azure sourceLogs Ingestion APIFile-based logs and any data you collect from a monitored resource.


Working with Microsoft Sentinel and Microsoft Defender for Cloud

Microsoft Sentinel and Microsoft Defender for Cloud perform Security monitoring in Azure.

These services store their data in Azure Monitor Logs so that it can be analyzed with other log data collected by Azure Monitor.