Friday 12 July 2024

View and use Change Analysis in Azure Monitor


View and use Change Analysis in Azure Monitor

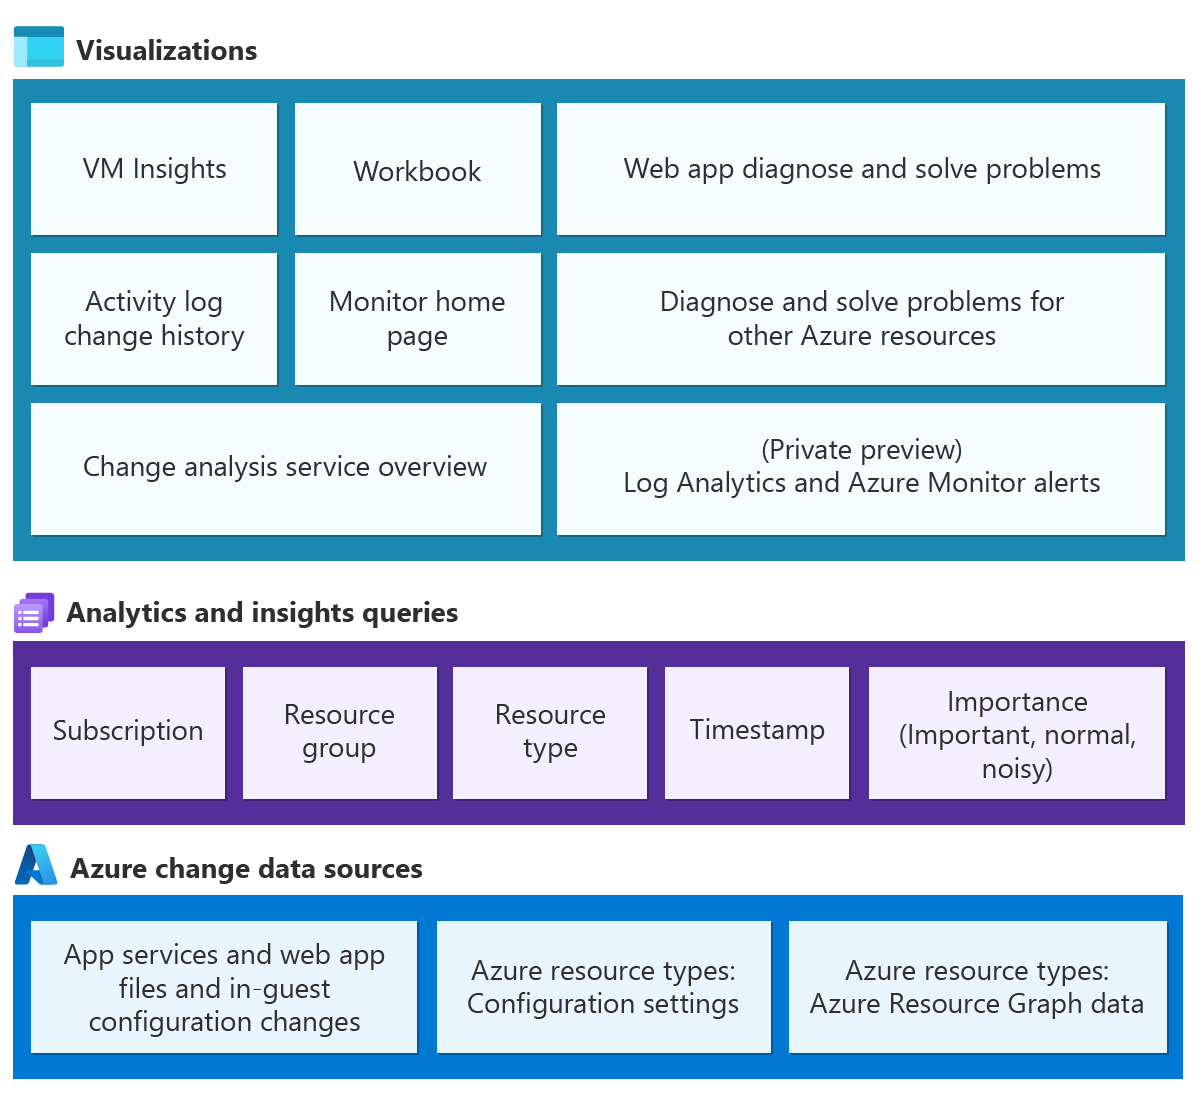
Change Analysis provides data for various management and troubleshooting scenarios to help you understand what changes to your application caused breaking issues.

View Change Analysis data

Access Change Analysis screens

You can access the Change Analysis overview portal under Azure Monitor, where you can view all changes and application dependency/resource insights. You can access Change Analysis through two entry points:

Via the Azure Monitor home page

From the Azure portal home page, select Monitor from the menu.

Screenshot of finding the Monitor home page from the main portal menu.

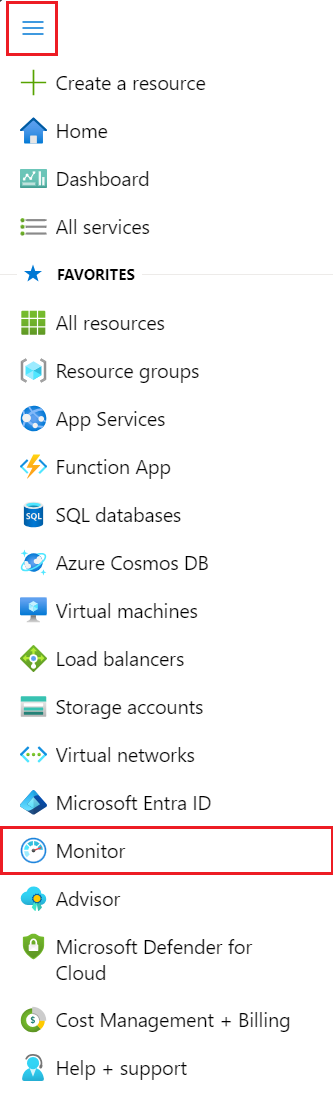
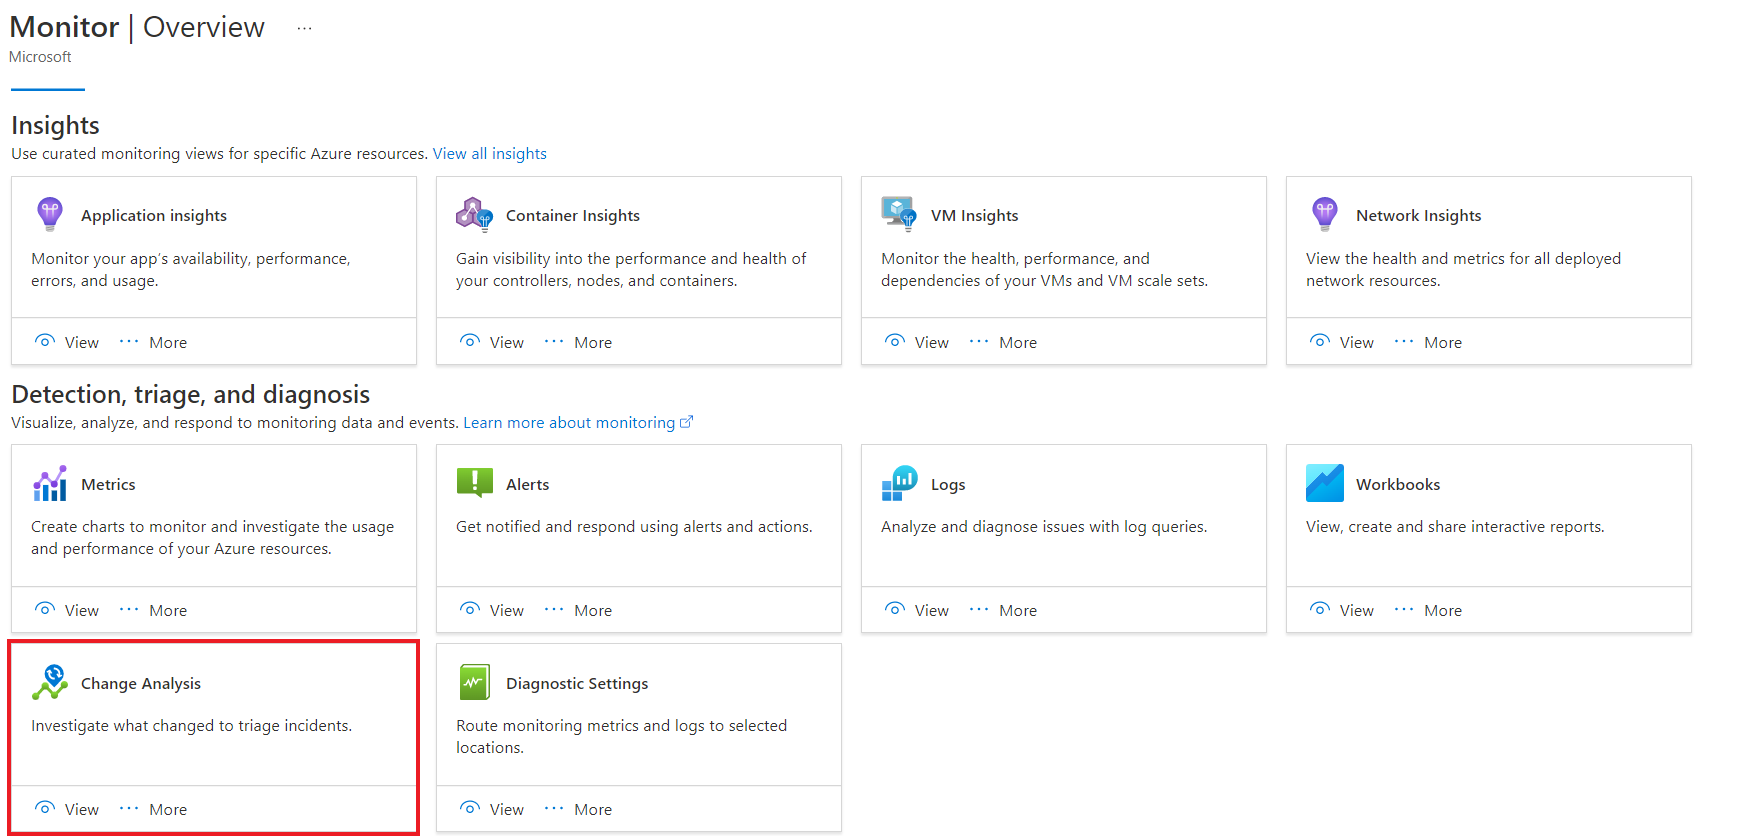
In the Monitor overview page, select the Change Analysis card.

Screenshot of selecting the Change Analysis card on the Monitor overview page.

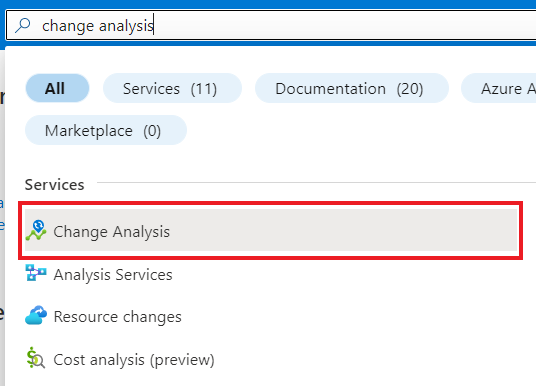
In the Azure portal, search for Change Analysis to launch the experience.

Screenshot of searching Change Analysis in Azure portal

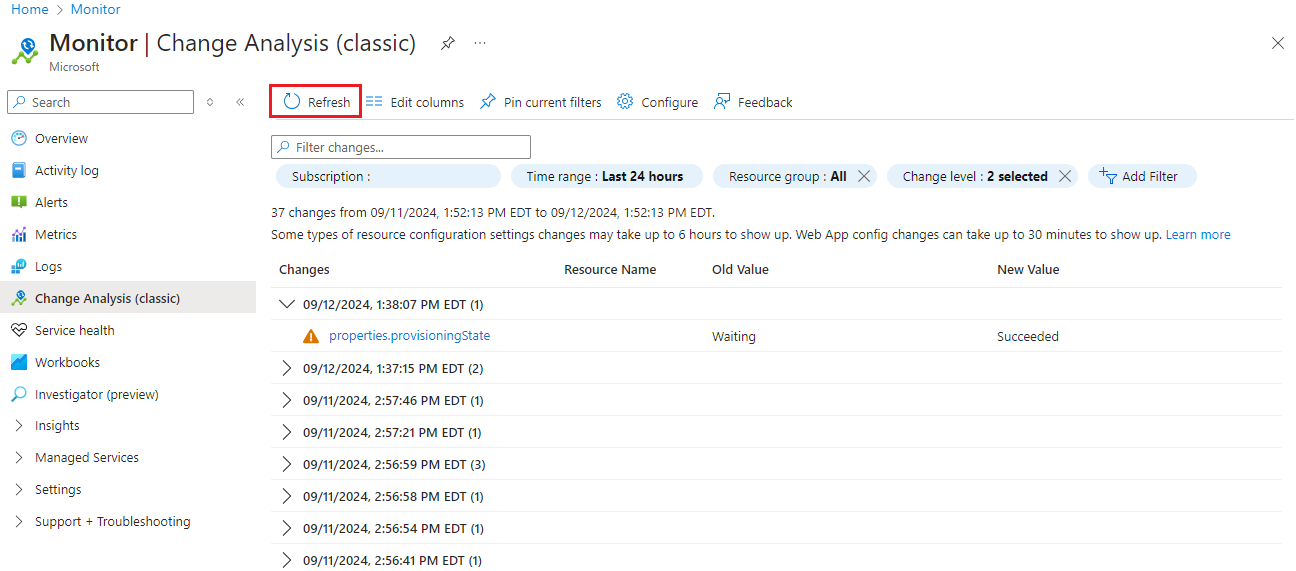
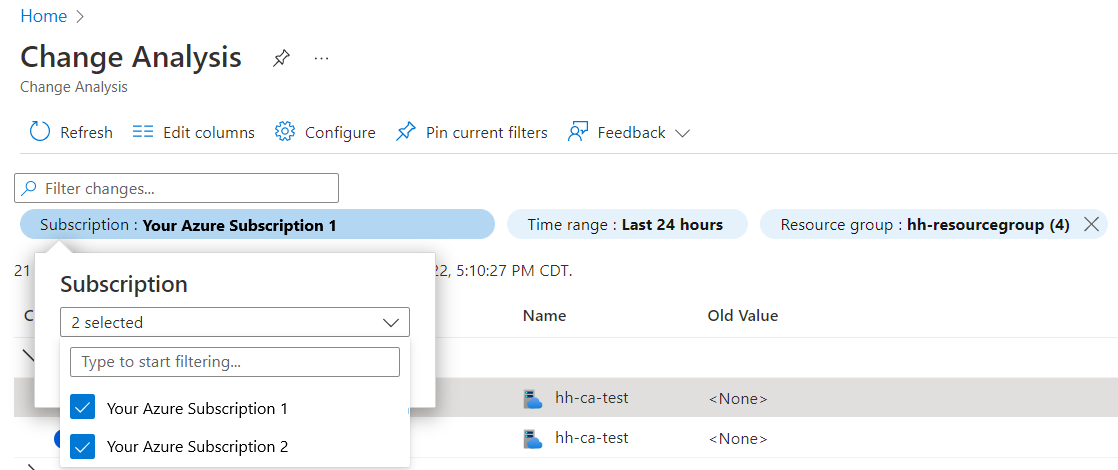
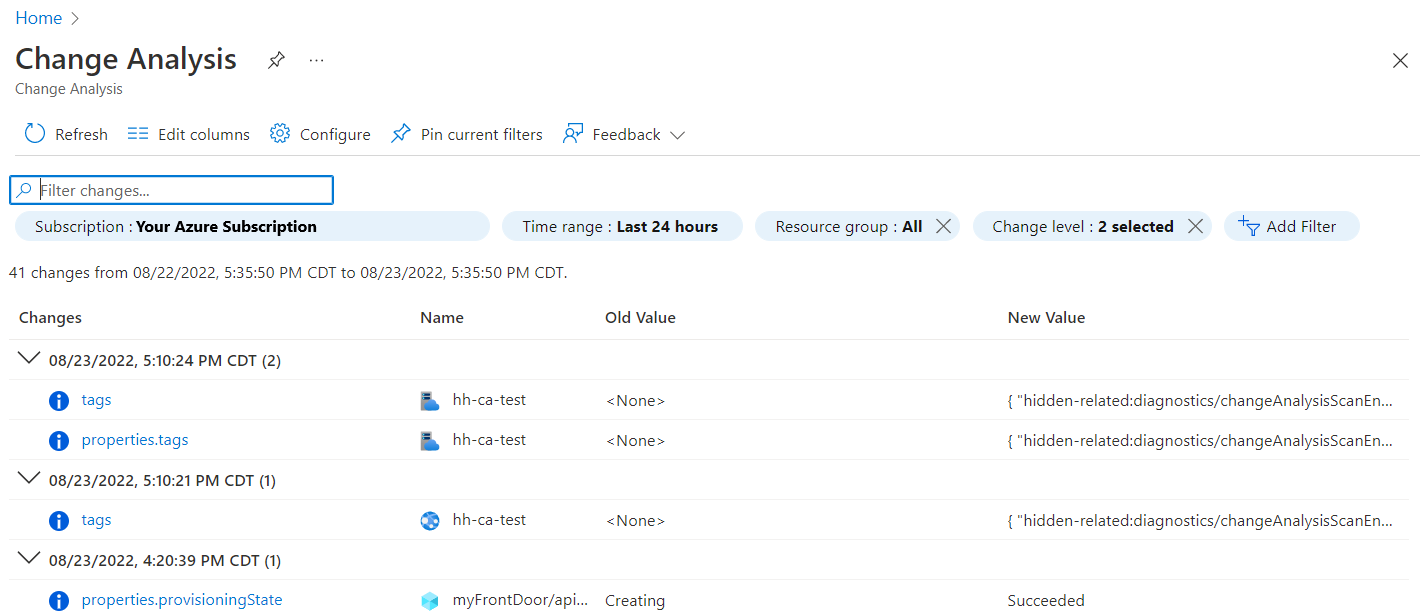
Select one or more subscriptions to view:

  • All of its resources' changes from the past 24 hours.
  • Old and new values to provide insights at one glance.

Screenshot of Change Analysis pane in Azure portal

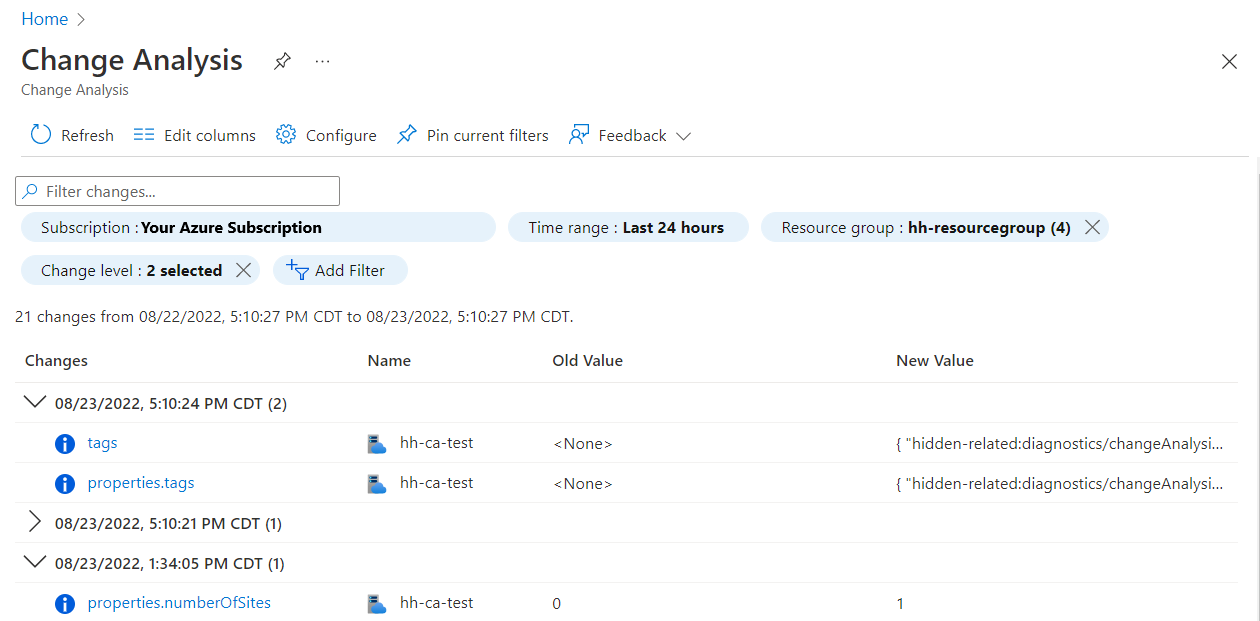
Click into a change to view full Resource Manager snippet and other properties.

Screenshot of change details

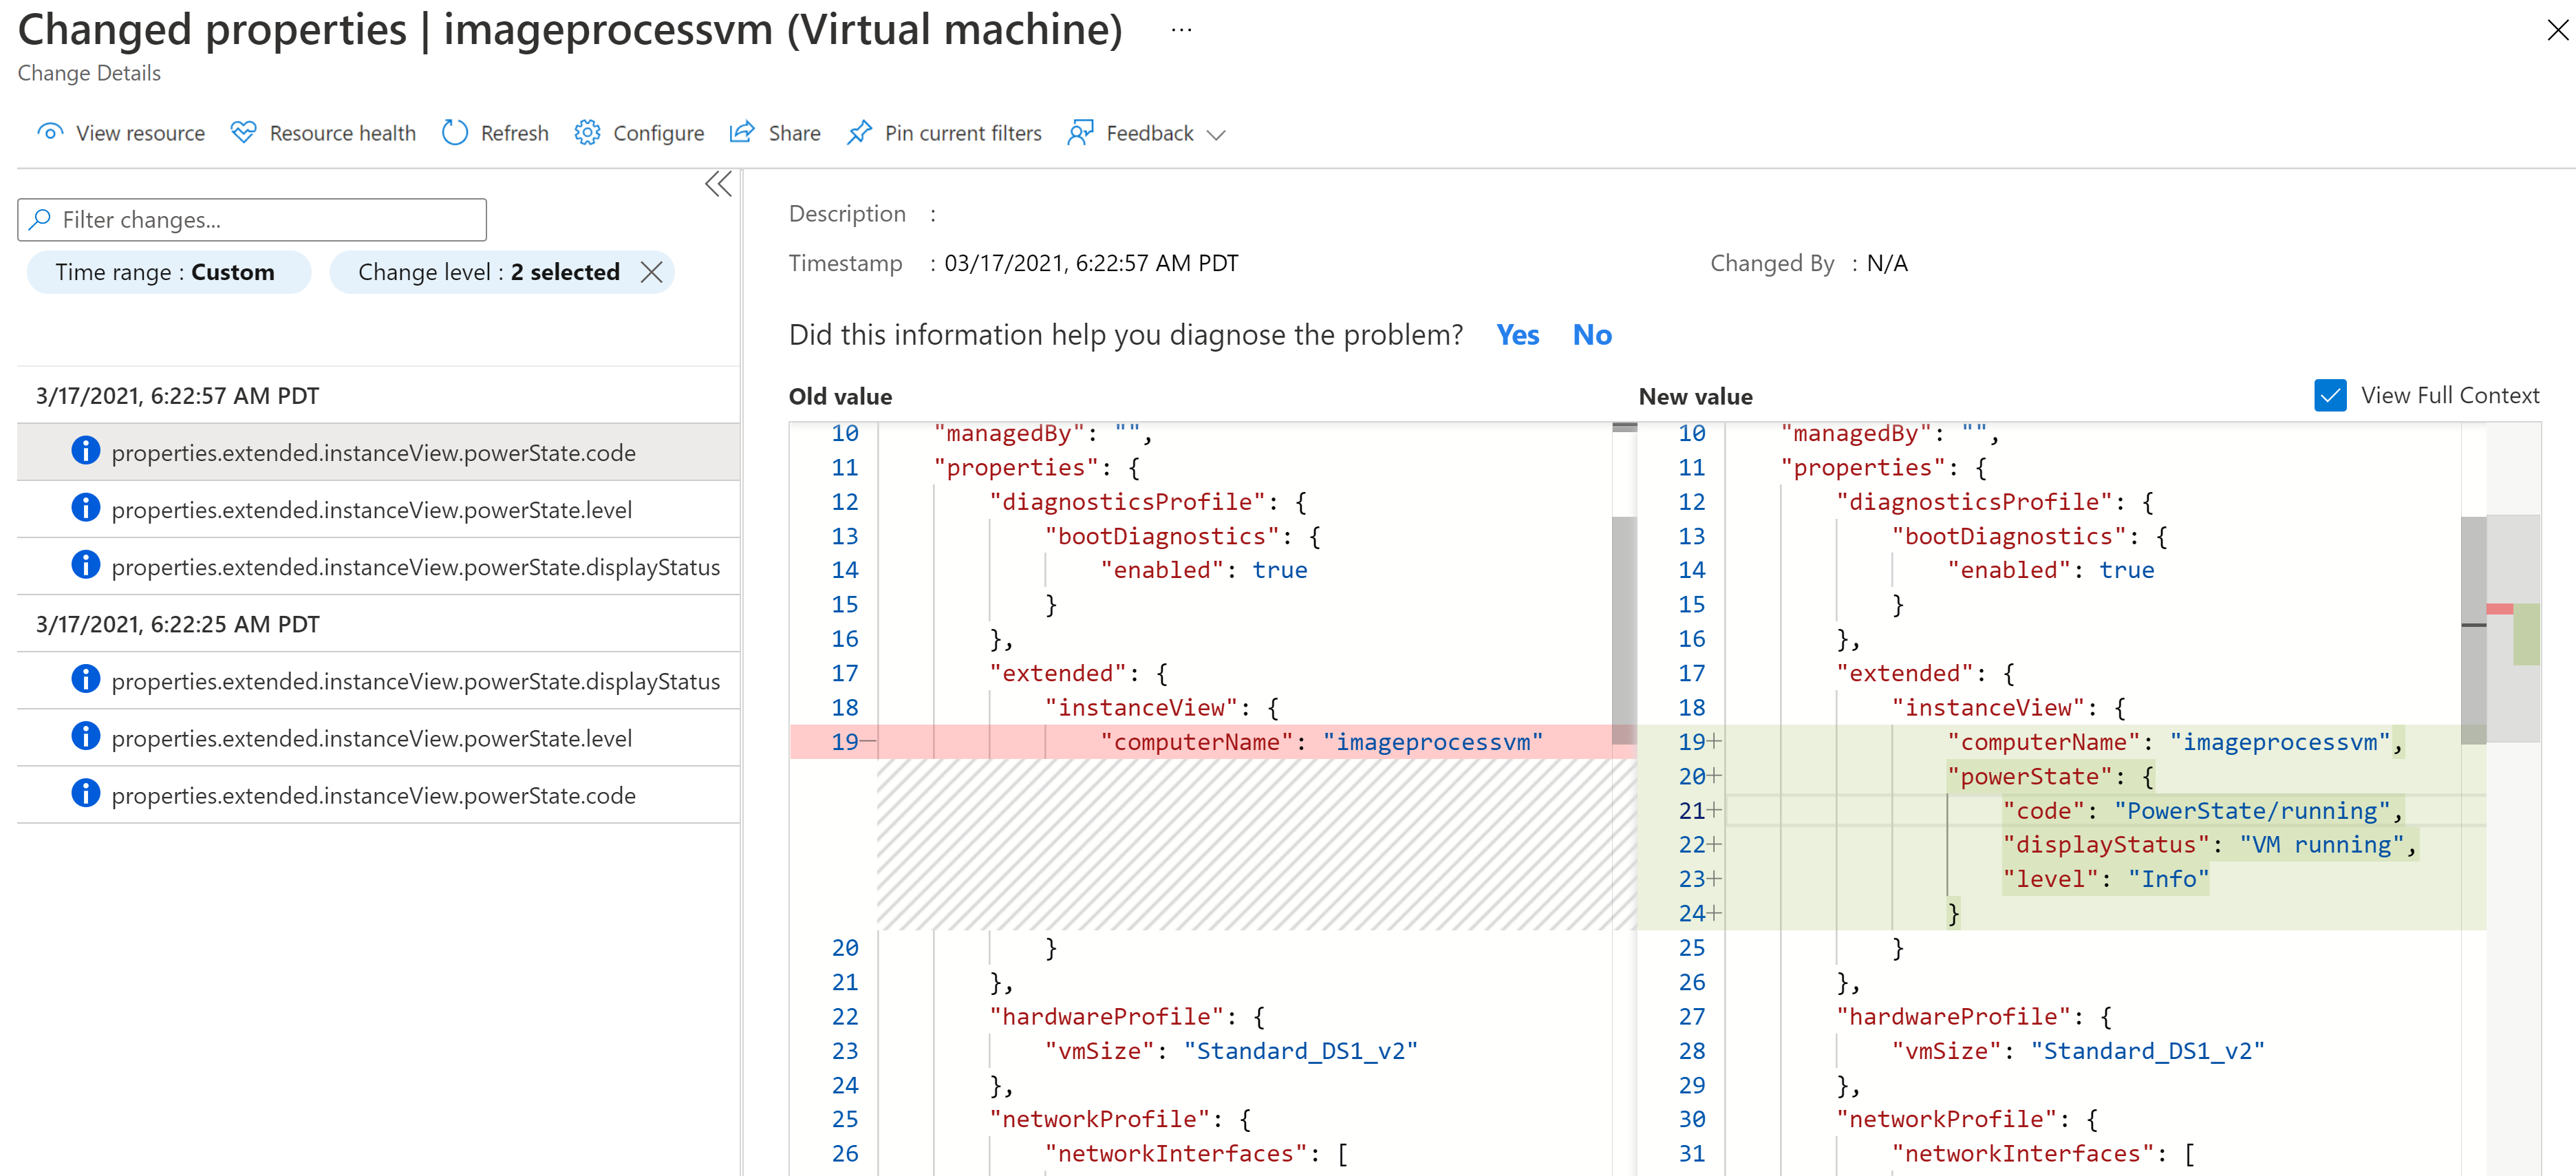
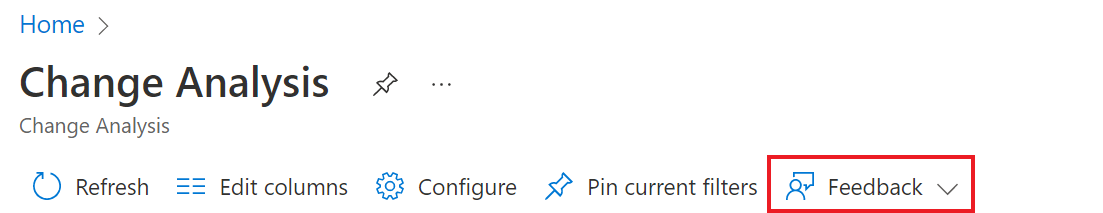
Send feedback from the Change Analysis pane:

Screenshot of feedback button in Change Analysis tab

Multiple subscription support

The UI supports selecting multiple subscriptions to view resource changes. Use the subscription filter:

Screenshot of subscription filter that supports selecting multiple subscriptions

View the Activity Log change history

Use the View change history feature to call the Azure Monitor Change Analysis service backend to view changes associated with an operation. Changes returned include:

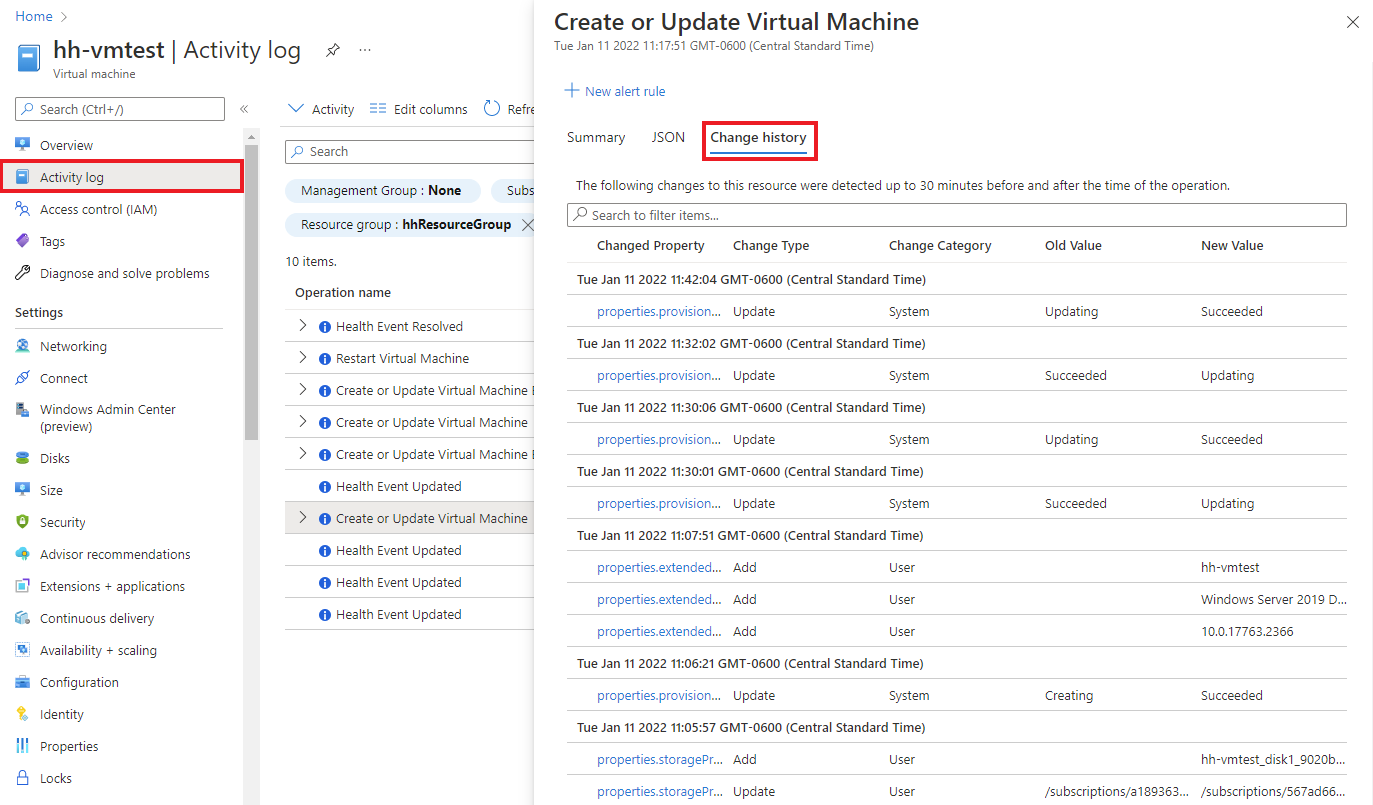
  1. From within your resource, select Activity Log from the side menu.

  2. Select a change from the list.

  3. Select the Change history tab.

  4. For the Azure Monitor Change Analysis service to scan for changes in users' subscriptions, a resource provider needs to be registered. When you select the Change history tab, the tool automatically registers Microsoft.ChangeAnalysis resource provider.

  5. Once registered, you can view changes from Azure Resource Graph immediately from the past 14 days.

    • Changes from other sources will be available after ~4 hours after subscription is onboard.

    Screenshot showing Activity Log change history integration.

View changes using the Diagnose and Solve Problems tool

From your resource's overview page in Azure portal, you can view change data by selecting Diagnose and solve problems the left menu. As you enter the Diagnose and Solve Problems tool, the Microsoft.ChangeAnalysis resource provider is automatically registered.

Learn how to use the Diagnose and Solve Problems tool for:

Diagnose and solve problems tool for Web App

Azure Monitor's Change Analysis is:

  • A standalone detector in the Web App Diagnose and solve problems tool.
  • Aggregated in Application Crashes and Web App Down detectors.

You can view change data via the Web App Down and Application Crashes detectors. The graph summarizes:

  • The change types over time.
  • Details on those changes.

By default, the graph displays changes from within the past 24 hours help with immediate problems.

Diagnose and solve problems tool for Virtual Machines

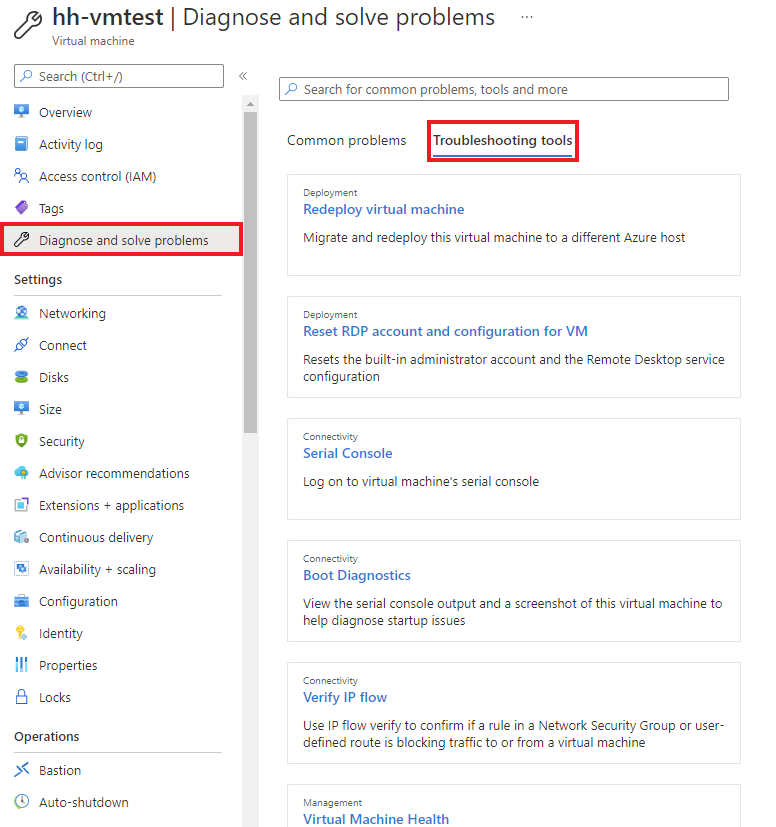
Change Analysis displays as an insight card in your virtual machine's Diagnose and solve problems tool. The insight card displays the number of changes or issues a resource experiences within the past 72 hours.

  1. Within your virtual machine, select Diagnose and solve problems from the left menu.

  2. Go to Troubleshooting tools.

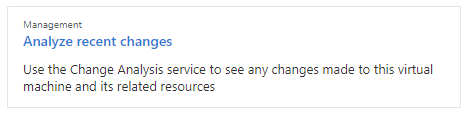
  3. Scroll to the end of the troubleshooting options and select Analyze recent changes to view changes on the virtual machine.

    Screenshot of the VM Diagnose and Solve Problems

    Change analyzer in troubleshooting tools

Diagnose and solve problems tool for Azure SQL Database and other resources

You can view Change Analysis data for multiple Azure resources, but we highlight Azure SQL Database in these steps.

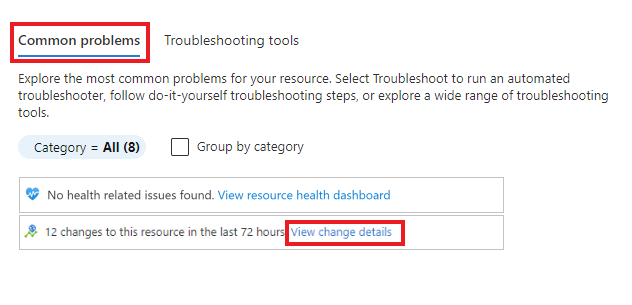
  1. Within your resource, select Diagnose and solve problems from the left menu.

  2. Under Common problems, select View change details to view the filtered view from Change Analysis standalone UI.

    Screenshot of viewing common problems in Diagnose and Solve Problems tool.

Activities using Change Analysis

Integrate with VM Insights

If you enabled VM Insights, you can view changes in your virtual machines that caused any spikes in a metric chart, such as CPU or Memory.

  1. Within your virtual machine, select Insights from under Monitoring in the left menu.

  2. Select the Performance tab.

  3. Expand the property panel.

    Virtual machine insights performance and property panel.

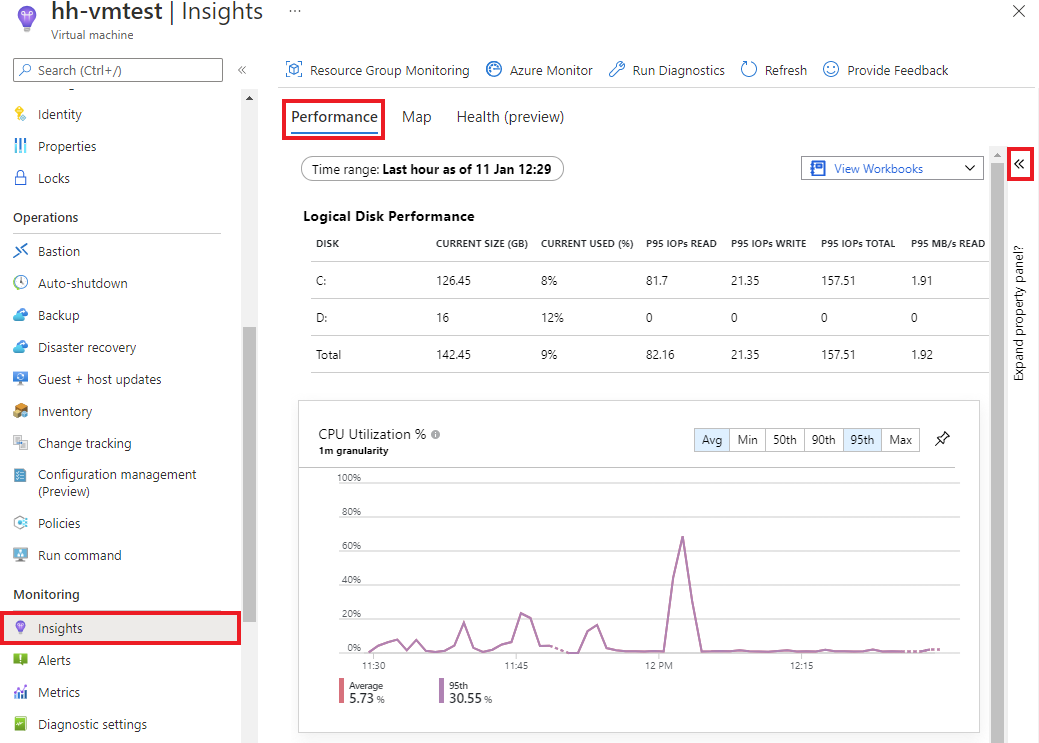
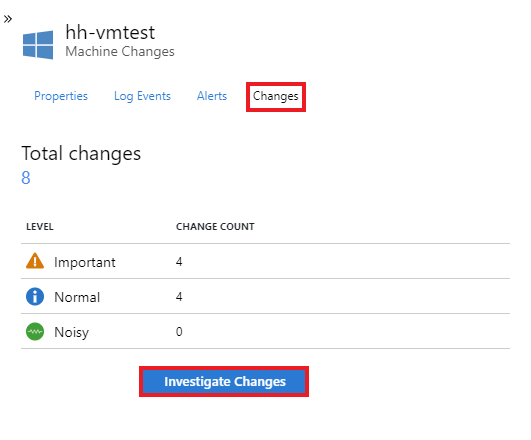
  4. Select the Changes tab.

  5. Select the Investigate Changes button to view change details in the Azure Monitor Change Analysis standalone UI.

    View of the property panel, selecting Investigate Changes button.

Drill to Change Analysis logs

You can also drill to Change Analysis logs via a chart you've created or pinned to your resource's Monitoring dashboard.

  1. Navigate to the resource for which you'd like to view Change Analysis logs.

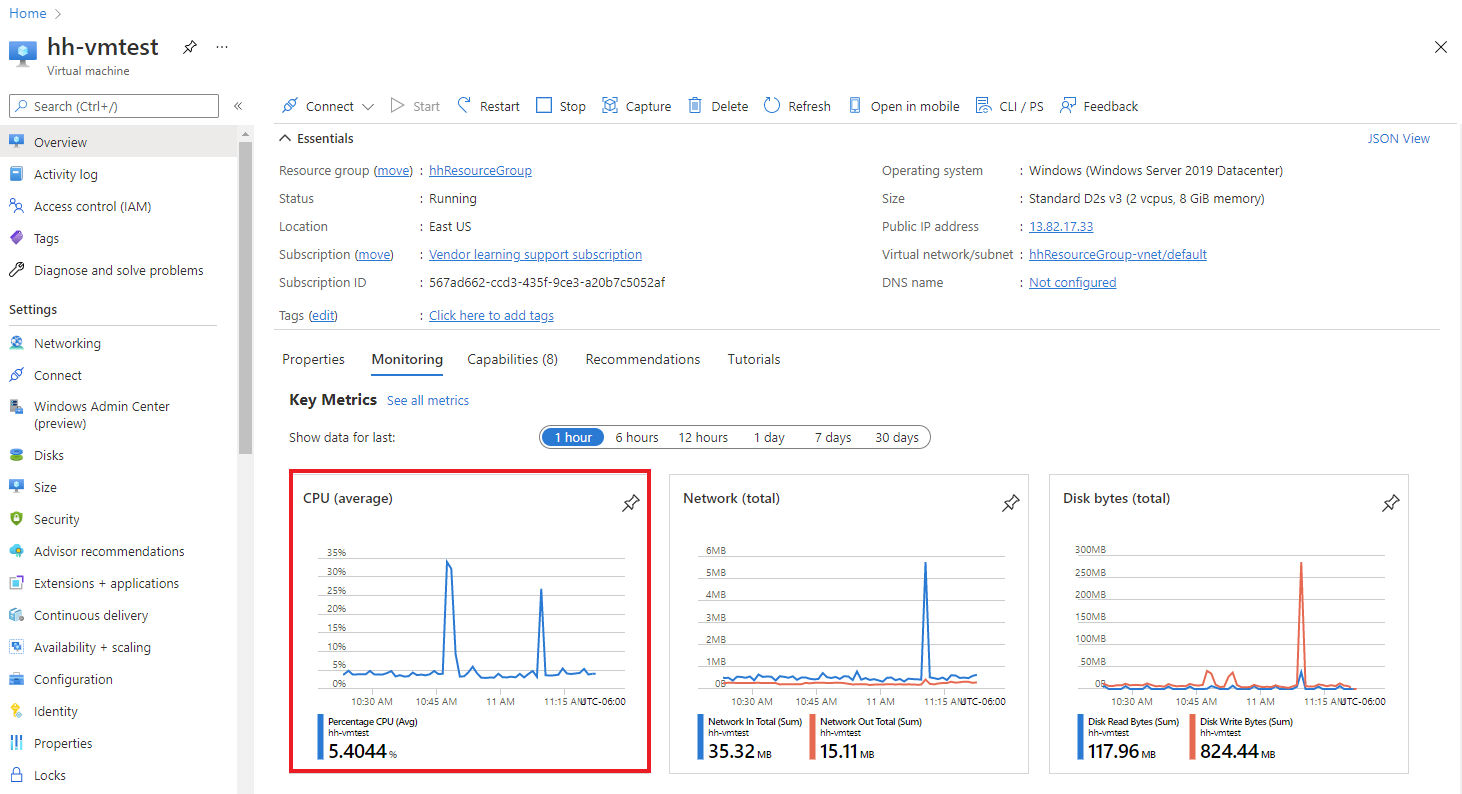
  2. On the resource's overview page, select the Monitoring tab.

  3. Select a chart from the Key Metrics dashboard.

    Chart from the Monitoring tab of the resource.

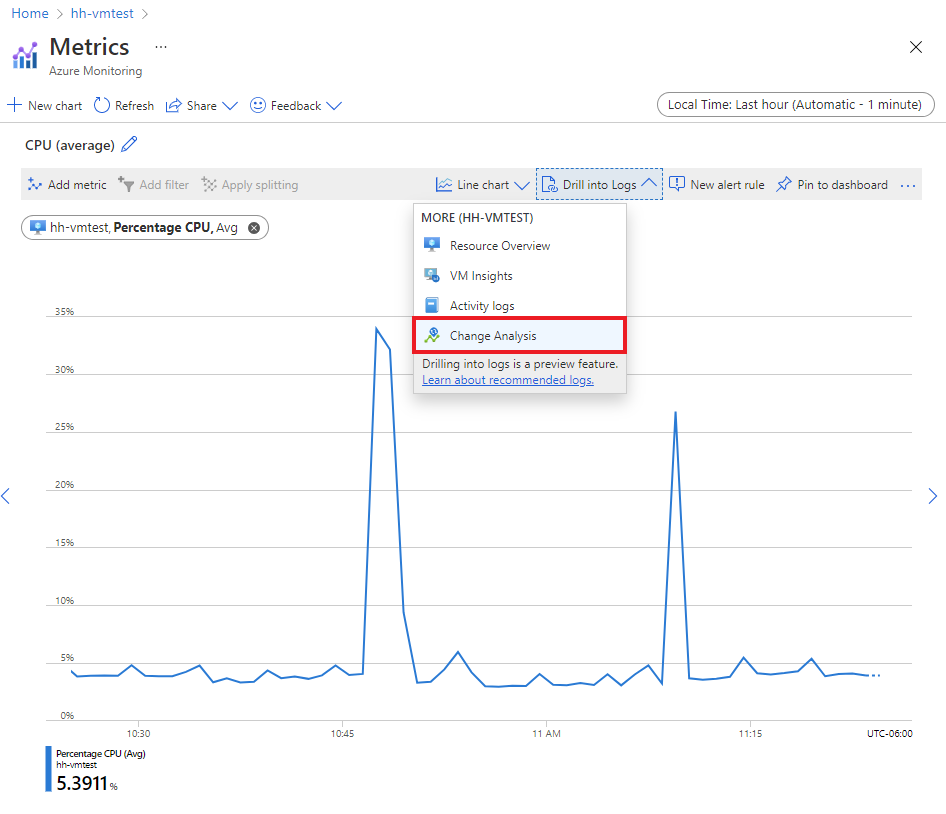
  4. From the chart, select Drill into logs and choose Change Analysis to view it.

    Drill into logs and select to view Change Analysis.

Browsing through a long list of changes in the entire subscription is time consuming. With Change Analysis custom filters and search capability, you can efficiently navigate to changes relevant to issues for troubleshooting.

Screenshot showing that filters and search bar are available at the top of Change Analysis homepage, right above the changes section.

Filters

FilterDescription
SubscriptionThis filter is in-sync with the Azure portal subscription selector. It supports multiple-subscription selection.
Time rangeSpecifies how far back the UI display changes, up to 14 days. By default, it’s set to the past 24 hours.
Resource groupSelect the resource group to scope the changes. By default, all resource groups are selected.
Change levelControls which levels of changes to display. Levels include: important, normal, and noisy.
Important: related to availability and security
Noisy: Read-only properties that are unlikely to cause any issues
By default, important and normal levels are checked.
ResourceSelect Add filter to use this filter.
Filter the changes to specific resources. Helpful if you already know which resources to look at for changes. If the filter is only returning 1,000 resources, see the corresponding solution in troubleshooting guide.
Resource typeSelect Add filter to use this filter.
Filter the changes to specific resource types.

The search bar filters the changes according to the input keywords. Search bar results apply only to the changes loaded by the page already and don't pull in results from the server side.

Pin and share a Change Analysis query to the Azure dashboard

Let's say you want to curate a change view on specific resources, like all Virtual Machine changes in your subscription, and include it in a report sent periodically. You can pin the view to an Azure dashboard for monitoring or sharing scenarios. If you'd like to share a specific change with your team members, you can use the share feature in the Change Details page.

Pin to the Azure dashboard

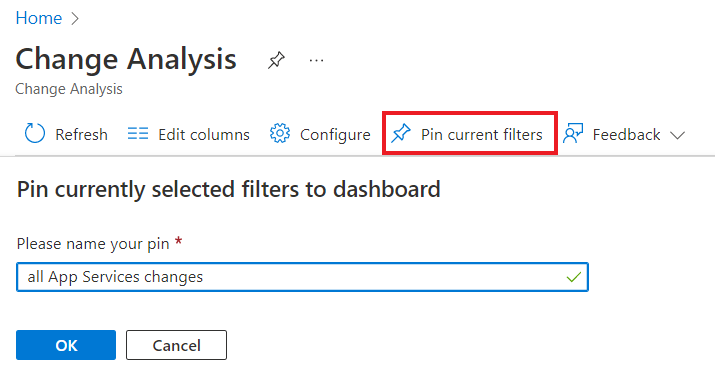
Once you applied filters to the Change Analysis homepage:

  1. Select Pin current filters from the top menu.

  2. Enter a name for the pin.

  3. Click OK to proceed.

    Screenshot of selecting Pin current filters button in Change Analysis.

A side pane opens to configure the dashboard where you place your pin. You can select one of two dashboard types:

Dashboard typeDescription
PrivateOnly you can access a private dashboard. Choose this option if you're creating the pin for your own easy access to the changes.
SharedA shared dashboard supports role-based access control for view/read access. Shared dashboards are created as a resource in your subscription with a region and resource group to host it. Choose this option if you're creating the pin to share with your team.

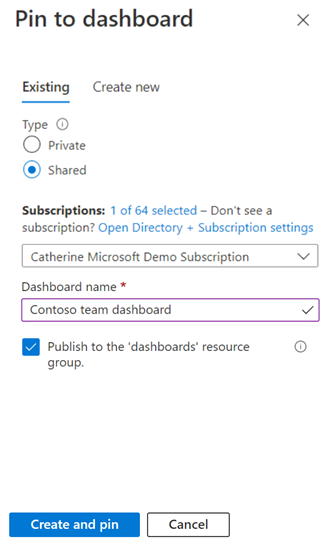
Select an existing dashboard

If you already have a dashboard to place the pin:

  1. Select the Existing tab.

  2. Select either Private or Shared.

  3. Select the dashboard you'd like to use.

  4. If you selected Shared, select the subscription in which you'd like to place the dashboard.

  5. Select Pin.

    Screenshot of selecting an existing dashboard to pin your changes to.

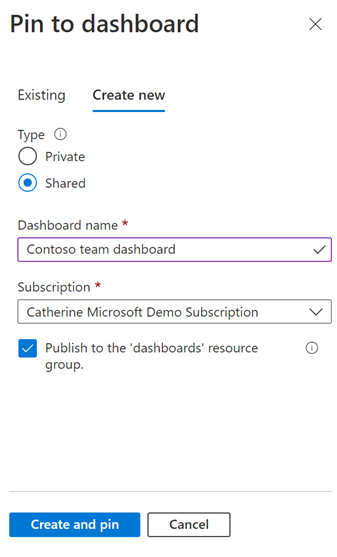
Create a new dashboard

You can create a new dashboard for this pin.

  1. Select the Create new tab.

  2. Select either Private or Shared.

  3. Enter the name of the new dashboard.

  4. If you're creating a shared dashboard, enter the resource group and region information.

  5. Click Create and pin.

    Screenshot of creating a new dashboard to pin your changes to.

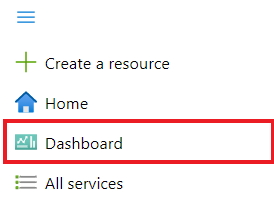
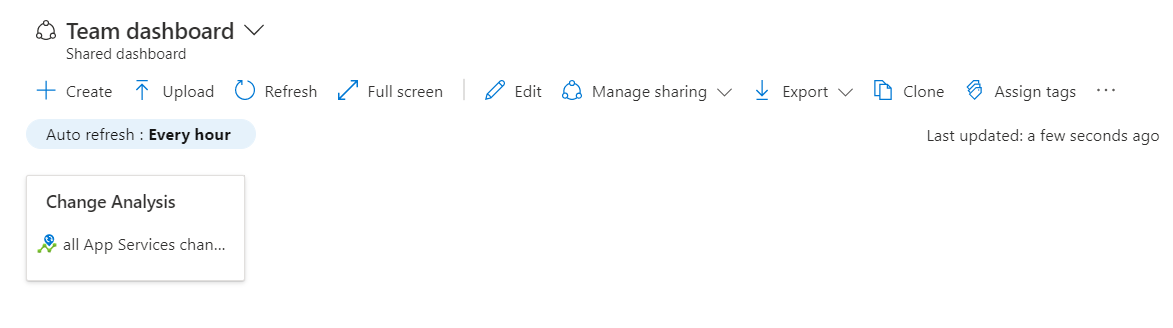
Once the dashboard and pin are created, navigate to the Azure dashboard to view them.

  1. From the Azure portal home menu, select Dashboard.

  2. Use the Manage Sharing button in the top menu to handle access or "unshare".

  3. Click on the pin to navigate to the curated view of changes.

    Screenshot of selecting the Dashboard in the Azure portal home menu.

    Screenshot of the pin in the dashboard.

Share a single change with your team

In the Change Analysis homepage, select a line of change to view details on the change.

  1. On the Changed properties page, select Share from the top menu.

  2. On the Share Change Details pane, copy the deep link of the page and share with your team in messages, emails, reports, or whichever communication channel your team prefers.

    Screenshot of selecting the share button on the dashboard and copying link.

Use Change Analysis in Azure Monitor


Use Change Analysis in Azure Monitor

While standard monitoring solutions might alert you to a live site issue, outage, or component failure, they often don't explain the cause. Let's say your site worked five minutes ago, and now it's broken. What changed in the last five minutes?

Change Analysis is designed to answer that question in Azure Monitor.

Building on the power of Azure Resource Graph, Change Analysis:

  • Provides insights into your Azure application changes.
  • Increases observability.
  • Reduces mean time to repair (MTTR).

Change Analysis architecture

Change Analysis detects various types of changes, from the infrastructure layer through application deployment. Change Analysis is a subscription-level Azure resource provider that:

  • Checks resource changes in the subscription.
  • Provides data for various diagnostic tools to help users understand what changes caused issues.

The following diagram illustrates the architecture of Change Analysis:

Architecture diagram of how Change Analysis gets change data and provides it to client tools.

Supported resource types

Azure Monitor Change Analysis service supports resource property level changes in all Azure resource types, including common resources like:

  • Virtual Machine
  • Virtual machine scale set
  • App Service
  • Azure Kubernetes Service (AKS)
  • Azure Function
  • Networking resources:
    • Network Security Group
    • Virtual Network
    • Application Gateway, etc.
  • Data services:
    • Storage
    • SQL
    • Redis Cache
    • Azure Cosmos DB, etc.

Data sources

Azure Monitor's Change Analysis queries for:

Change Analysis also tracks resource dependency changes to diagnose and monitor an application end-to-end.

Azure Resource Manager resource properties changes

Using Azure Resource Graph, Change Analysis provides a historical record of how the Azure resources that host your application changed over time. The following basic configuration settings are set using Azure Resource Manager and tracked by Azure Resource Graph:

  • Managed identities
  • Platform OS upgrade
  • Hostnames

Resource configuration changes

In addition to the settings set via Azure Resource Manager, you can set configuration settings using the CLI, Bicep, etc., such as:

  • IP Configuration rules
  • TLS settings
  • Extension versions

Azure Resource Graph doesn't capture these setting changes. Change Analysis fills this gap by capturing snapshots of changes in those main configuration properties, like changes to the connection string, etc. Snapshots are taken of configuration changes and change details every up to 6 hours.

See known limitations regarding resource configuration change analysis.

Changes in Azure Function and Web Apps (in-guest changes)

Every 30 minutes, Change Analysis captures the configuration state of a web application. For example, it can detect changes in the application environment variables, configuration files, and WebJobs. The tool computes the differences and presents the changes.

Screenshot of the selecting the Refresh button to view latest changes.

Refer to our troubleshooting guide if you don't see:

  • File changes within 30 minutes
  • Configuration changes within 6 hours

See known limitations regarding in-guest change analysis.

Currently, all text-based files under site root wwwroot with the following extensions are supported:

  • *.json
  • *.xml
  • *.ini
  • *.yml
  • *.config
  • *.properties
  • *.html
  • *.cshtml
  • *.js
  • requirements.txt
  • Gemfile
  • Gemfile.lock
  • config.gemspec

Automatically scale a Virtual Machine Scale Set in the Azure portal


Automatically scale a Virtual Machine Scale Set in the Azure portal

When you create a scale set, you define the number of VM instances that you wish to run. As your application demand changes, you can automatically increase or decrease the number of VM instances. The ability to autoscale lets you keep up with customer demand or respond to application performance changes throughout the lifecycle of your app.

This article shows you how to create autoscale rules in the Azure portal that monitor the performance of the VM instances in your scale set. These autoscale rules increase or decrease the number of VM instances in response to these performance metrics. You can also complete these steps with Azure PowerShell or the Azure CLI.

Prerequisites

To create autoscale rules, you need an existing Virtual Machine Scale Set. You can create a scale set with the Azure portalAzure PowerShell, or Azure CLI.

Create a rule to automatically scale out

If your application demand increases, the load on the VM instances in your scale set increases. If this increased load is consistent, rather than just a brief demand, you can configure autoscale rules to increase the number of VM instances in the scale set. When these VM instances are created and your applications are deployed, the scale set starts to distribute traffic to them through the load balancer. You control what metrics to monitor, such as CPU or disk, how long the application load must meet a given threshold, and how many VM instances to add to the scale set.

  1. Open the Azure portal and select Resource groups from the menu on the left-hand side of the dashboard.

  2. Select the resource group that contains your scale set, then choose your scale set from the list of resources.

  3. Choose Scaling from the menu on the left-hand side of the scale set window. Select the button to Custom autoscale:

    Enable autoscale in the Azure portal

  4. Select the option to Add a ruleAdd autoscale rule in the Azure portal

  5. Let's create a rule that increases the number of VM instances in a scale set when the average CPU load is greater than 70% over a 10-minute period. When the rule triggers, the number of VM instances is increased by 20%. In scale sets with a small number of VM instances, you could set the Operation to Increase count by and then specify 1 or 2 for the Instance count. In scale sets with a large number of VM instances, an increase of 10% or 20% VM instances may be more appropriate.

    Specify the following settings for your rule:

    ParameterExplanationValue
    Time AggregationDefines how the collected metrics should be aggregated for analysis.Average
    Metric NameThe performance metric to monitor and apply scale set actions on.Percentage CPU
    Time grain statisticDefines how the collected metrics in each time grain should be aggregated for analysis.Average
    OperatorOperator used to compare the metric data against the threshold.Greater than
    ThresholdThe percentage that causes the autoscale rule to trigger an action.70
    DurationThe amount of time monitored before the metric and threshold values are compared. Does not include cool down period.10 minutes
    OperationDefines if the scale set should scale up or down when the rule applies and by what increment.Increase percent by
    Instance countThe percentage of VM instances should be changed when the rule triggers.20
    Cool down (minutes)The amount of time to wait before the rule is applied again so that the autoscale actions have time to take effect.5 minutes

    The following examples show a rule created in the Azure portal that matches these settings:

    Create an autoscale rule to increase the number of VM instances

     Note

    Tasks running inside the instance will abruptly stop and the instance will scale down once it completes the cooling period.

  6. To create the rule, select Add

Create a rule to automatically scale in

On an evening or weekend, your application demand may decrease. If this decreased load is consistent over a period of time, you can configure autoscale rules to decrease the number of VM instances in the scale set. This scale-in action reduces the cost to run your scale set as you only run the number of instances required to meet the current demand.

  1. Choose to Add a rule again.

  2. Create a rule that decreases the number of VM instances in a scale set when the average CPU load then drops below 30% over a 10-minute period. When the rule triggers, the number of VM instances is decreased by 20%.

    Use the same approach as with the previous rule. Adjust the following settings for your rule:

    ParameterExplanationValue
    OperatorOperator used to compare the metric data against the threshold.Less than
    ThresholdThe percentage that causes the autoscale rule to trigger an action.30
    OperationDefines if the scale set should scale up or down when the rule applies and by what incrementDecrease percent by
    Instance countThe percentage of VM instances should be changed when the rule triggers.20
  3. To create the rule, select Add

Define autoscale instance limits

Your autoscale profile must define a minimum, maximum, and default number of VM instances. When your autoscale rules are applied, these instance limits make sure that you do not scale out beyond the maximum number of instances, or scale in beyond the minimum of instances.

  1. Set the following instance limits:

    MinimumMaximumDefault
    2102
  2. To apply your autoscale rules and instance limits, select Save.

Monitor number of instances in a scale set

To see the number and status of VM instances, select Instances from the menu on the left-hand side of the scale set window. The status indicates if the VM instance is Creating as the scale set automatically scales out, or is Deleting as the scale automatically scales in.

View a list of scale set VM instances

Autoscale based on a schedule

The previous examples automatically scaled a scale set in or out with basic host metrics such as CPU usage. You can also create autoscale rules based on schedules. These schedule-based rules allow you to automatically scale out the number of VM instances ahead of an anticipated increase in application demand, such as core work hours, and then automatically scale in the number of instances at a time that you anticipate less demand, such as the weekend.

  1. Choose Scaling from the menu on the left-hand side of the scale set window.

  2. Choose to Add a scale condition. Select the pencil icon next to rule name, and provide a name such as Scale out during each work day.

    Rename the default autoscale rule

  3. Select the radio button to Scale to a specific instance count.

  4. To scale up the number of instances, enter 10 as the instance count.

  5. Choose Repeat specific days for the Schedule type.

  6. Select all the work days, Monday through Friday.

  7. Choose the appropriate timezone, then specify a Start time of 09:00.

  8. Choose to Add a scale condition again. Repeat the process to create a schedule named Scale in during the evening that scales to 3 instances, repeats every weekday, and starts at 18:00.

  9. To apply your schedule-based autoscale rules, select Save.

    Create autoscale rules that scale on a schedule

To see how your autoscale rules are applied, select Run history across the top of the Scaling window. The graph and events list shows when the autoscale rules trigger and the number of VM instances in your scale set increases or decreases.