Friday 12 July 2024

Create a log search alert for an Azure resource


Create a log search alert for an Azure resource

Prerequisites

To complete this tutorial, you need the following:

  • An Azure resource to monitor. You can use any resource in your Azure subscription that supports diagnostic settings. To determine whether a resource supports diagnostic settings, go to its menu in the Azure portal and verify that there's a Diagnostic settings option in the Monitoring section of the menu.

If you're using any Azure resource other than a virtual machine:

If you're using an Azure virtual machine:

Select a log query and verify results

Data is retrieved from a Log Analytics workspace using a log query written in Kusto Query Language (KQL). Insights and solutions in Azure Monitor provide log queries to retrieve data for a particular service, but you can work directly with log queries and their results in the Azure portal with Log Analytics.

Select Logs from your resource's menu. Log Analytics opens with the Queries window that includes prebuilt queries for your Resource type. Select Alerts to view queries designed for alert rules.

 Note

If the Queries window doesn't open, click Queries in the top right.

Log Analytics with queries window

Select a query and click Run to load it in the query editor and return results. You may want to modify the query and run it again. For example, the Show anonymous requests query for storage accounts is shown in the following screenshot. You may want to modify the AuthenticationType or filter on a different column.

Query results

Create alert rule

Once you verify your query, you can create the alert rule. Select New alert rule to create a new alert rule based on the current log query. The Scope is already set to the current resource. You don't need to change this value.

Create alert rule

Configure condition

On the Condition tab, the Log query is already filled in. The Measurement section defines how the records from the log query are measured. If the query doesn't perform a summary, then the only option is to Count the number of Table rows. If the query includes one or more summarized columns, then you have the option to use the number of Table rows or a calculation based on any of the summarized columns. Aggregation granularity defines the time interval over which the collected values are aggregated. For example, if the aggregation granularity is set to 5 minutes, the alert rule evaluates the data aggregated over the last 5 minutes. If the aggregation granularity is set to 15 minutes, the alert rule evaluates the data aggregated over the last 15 minutes. It is important to choose the right aggregation granularity for your alert rule, as it can affect the accuracy of the alert.

 Note

The combined size of all data in the log alert rule properties cannot exceed 64KB. This can be caused by too many dimensions, the query being too large, too many action groups, or a long description. When creating a large alert rule, remember to optimize these areas.

Alert rule condition

Configure dimensions

Split by dimensions allows you to create separate alerts for different resources. This setting is useful when you're creating an alert rule that applies to multiple resources. With the scope set to a single resource, this setting typically isn't used.

Alert rule dimensions

If you need certain dimensions included in the alert notification email, you can specify a dimension (for example, "Computer"), the alert notification email will include the computer name that triggered the alert. The alerting engine uses the alert query to determine the available dimensions. If you do not see the dimension you want in the drop-down list for the "Dimension name", it is because the alert query does not expose that column in the results. You can easily add the dimensions you want by adding a Project line to your query that includes the columns you want to use. You can also use the Summarize line to add more columns to the query results.

Screenshot showing the Alert rule dimensions with a dimension called Computer set.

Configure alert logic

In the alert logic, configure the Operator and Threshold value to compare to the value returned from the measurement. An alert is created when this value is true. Select a value for Frequency of evaluation which defines how often the log query is run and evaluated. The cost for the alert rule increases with a lower frequency. When you select a frequency, the estimated monthly cost is displayed in addition to a preview of the query results over a time period.

For example, if the measurement is Table rows, the alert logic may be Greater than 0 indicating that at least one record was returned. If the measurement is a columns value, then the logic may need to be greater than or less than a particular threshold value. In the following example, the log query is looking for anonymous requests to a storage account. If an anonymous request is made, then we should trigger an alert. In this case, a single row returned would trigger the alert, so the alert logic should be Greater than 0.

Alert logic

Configure actions

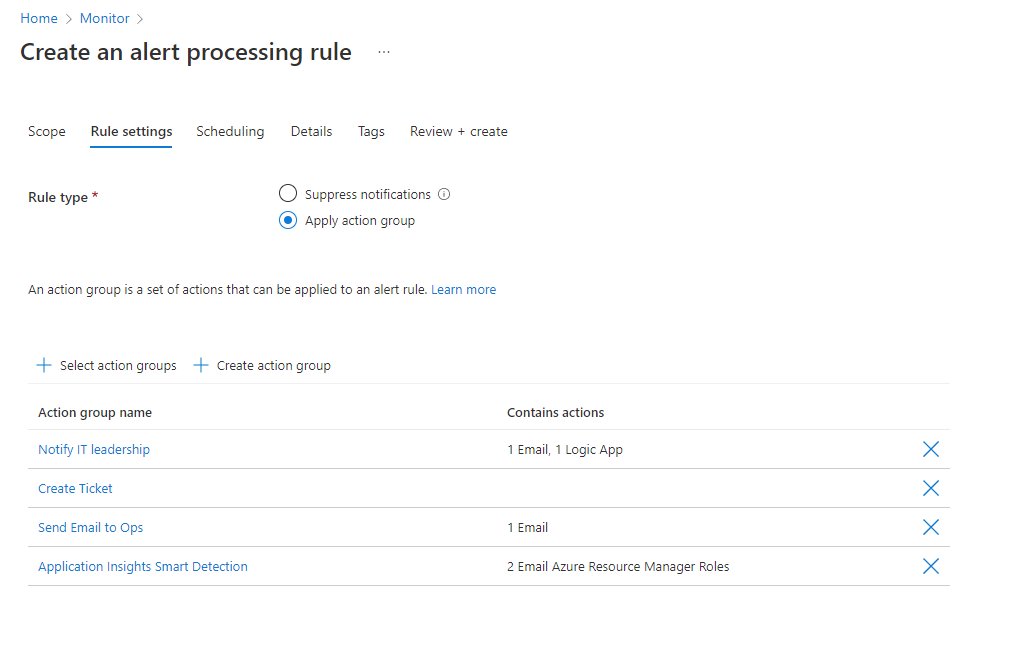
Action groups define a set of actions to take when an alert is fired such as sending an email or an SMS message.

To configure actions, select the Actions tab.

Screenshot that shows the Actions tab highlighted.

Click Select action groups to add one to the alert rule.

Screenshot that shows the Select action groups button.

If you don't already have an action group in your subscription to select, then click Create action group to create a new one.

Create action group

Select a Subscription and Resource group for the action group and give it an Action group name that will appear in the portal and a Display name that will appear in email and SMS notifications.

Action group basics

Select the Notifications tab and add one or more methods to notify appropriate people when the alert is fired.

Action group notifications

Configure details

Select the Details tab and configure different settings for the alert rule.

  • Alert rule name which should be descriptive since it will be displayed when the alert is fired.
  • Optionally provide an Alert rule description that's included in the details of the alert.
  • Subscription and Resource group where the alert rule will be stored. This doesn't need to be in the same resource group as the resource that you're monitoring.
  • Severity for the alert. The severity allows you to group alerts with a similar relative importance. A severity of Error is appropriate for an unresponsive virtual machine.
  • Under Advanced options, keep the box checked to Enable upon creation.
  • Under Advanced options, keep the box checked to Automatically resolve alerts. This will make the alert stateful, which means that the alert is resolved when the condition isn't met anymore.

Alert rule details

Click Create alert rule to create the alert rule.
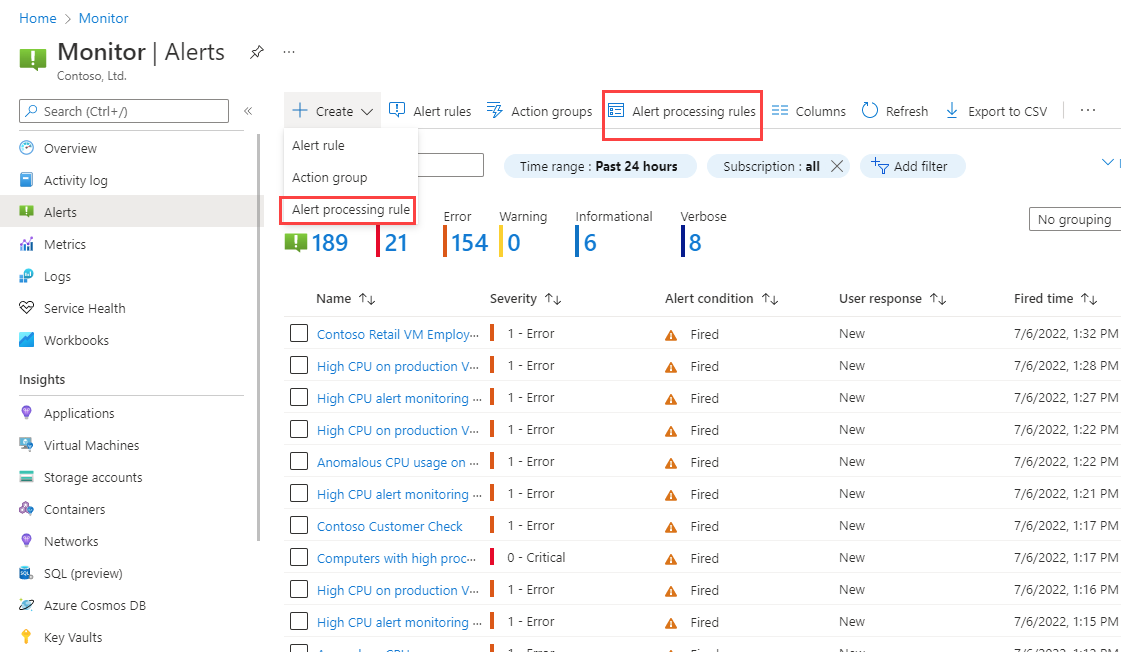
View the alert

When an alert fires, it sends any notifications in its action groups. You can also view the alert in the Azure portal.

Select Alerts from the resource's menu. If there are any open alerts for the resources, they are included in the view.

Alerts view

Click on a severity to show the alerts with that severity. Select the User response and unselect Closed to view only open alerts.

Screenshot that shows the User response filter.

Click on the name of an alert to view its detail.

Alert detail


Alert processing rules


Alert processing rules

Alert processing rules allow you to apply processing on fired alerts. Alert processing rules are different from alert rules. Alert rules generate new alerts that notify you when something happens, while alert processing rules modify the fired alerts as they're being fired to change the usual alert behavior.

You can use alert processing rules to add action groups or remove (suppress) action groups from your fired alerts. You can apply alert processing rules to different resource scopes, from a single resource, or to an entire subscription, as long as they are within the same subscription as the alert processing rule. You can also use them to apply various filters or have the rule work on a predefined schedule.

Some common use cases for alert processing rules are described here.

Suppress notifications during planned maintenance

Many customers set up a planned maintenance time for their resources, either on a one-time basis or on a regular schedule. The planned maintenance might cover a single resource, like a virtual machine, or multiple resources, like all virtual machines in a resource group. So, you might want to stop receiving alert notifications for those resources during the maintenance window. In other cases, you might prefer to not receive alert notifications outside of your business hours. Alert processing rules allow you to achieve that.

You could suppress alert notifications by disabling the alert rules themselves at the beginning of the maintenance window, and reenable them after the maintenance is over. In that case, the alerts won't fire in the first place. That approach has several limitations:

  • This approach is only practical if the scope of the alert rule is exactly the scope of the resources under maintenance. For example, a single alert rule might cover multiple resources, but only a few of those resources are going through maintenance. So, if you disable the alert rule, you won't be alerted when the remaining resources covered by that rule run into issues.
  • You might have many alert rules that cover the resource. Updating all of them is time consuming and error prone.
  • You might have some alerts that aren't created by an alert rule at all, like alerts from Azure Backup.

In all these cases, an alert processing rule provides an easy way to suppress notifications.

Management at scale

Most customers tend to define a few action groups that are used repeatedly in their alert rules. For example, they might want to call a specific action group whenever any high-severity alert is fired. As their number of alert rules grows, manually making sure that each alert rule has the right set of action groups is becoming harder.

Alert processing rules allow you to specify that logic in a single rule, instead of having to set it consistently in all your alert rules. They also cover alert types that aren't generated by an alert rule.

Add action groups to all alert types

Azure Monitor alert rules let you select which action groups will be triggered when their alerts are fired. However, not all Azure alert sources let you specify action groups. Some examples of such alerts include Azure Backup alertsVM Insights guest health alertsAzure Stack Edge, and Azure Stack Hub.

For those alert types, you can use alert processing rules to add action groups.

Scope and filters for alert processing rules

This section describes the scope and filters for alert processing rules.

Each alert processing rule has a scope. A scope is a list of one or more specific Azure resources, a specific resource group, or an entire subscription. The alert processing rule applies to alerts that fired on resources within that scope. You cannot create an alert processing rule on a resource from a different subscription.

You can also define filters to narrow down which specific subset of alerts are affected within the scope. The available filters are described in the following table.

FilterDescription
Alert context (payload)The rule applies only to alerts that contain any of the filter's strings within the alert context section of the alert. This section includes fields specific to each alert type.
Alert rule IDThe rule applies only to alerts from a specific alert rule. The value should be the full resource ID, for example, /subscriptions/SUB1/resourceGroups/RG1/providers/microsoft.insights/metricalerts/MY-API-LATENCY. To locate the alert rule ID, open a specific alert rule in the portal, select Properties, and copy the Resource ID value. You can also locate it by listing your alert rules from PowerShell or the Azure CLI.
Alert rule nameThe rule applies only to alerts with this alert rule name. It can also be useful with a Contains operator.
DescriptionThe rule applies only to alerts that contain the specified string within the alert rule description field.
Monitor conditionThe rule applies only to alerts with the specified monitor condition, either Fired or Resolved.
Monitor serviceThe rule applies only to alerts from any of the specified monitoring services that are sending the signal. Different services are available depending on the type of signal. For example:
- Platform: For metric signals, the monitor service is the metric namespace. ‘Platform’ means the metrics are provided by the resource provider, namely 'Azure'.
- Azure.ApplicationInsights: Customer-reported metrics, sent by the Application Insights SDK.
- Azure.VM.Windows.GuestMetrics: VM guest metrics, collected by an extension running on the VM. Can include built-in operating system perf counters, and custom perf counters.
<Custom namespace>: A custom metric namespace, containing custom metrics sent with the Azure Monitor Metrics API.
- Log Analytics: The service that provides the ‘Custom log search’ and ‘Log (saved query)’ signals.
- Activity Log – Administrative: The service that provides the ‘Administrative’ activity log events.
- Activity Log – Policy: The service that provides the 'Policy' activity log events.
- Activity Log – Autoscale The service that provides the ‘Autoscale’ activity log events.
- Activity Log – Security: The service that provides the ‘Security’ activity log events.
- Resource health: The service that provides the resource-level health status.
- Service health: The service that provides the subscription-level health status.
ResourceThe rule applies only to alerts from the specified Azure resource. For example, you can use this filter with Does not equal to exclude one or more resources when the rule's scope is a subscription.
Resource groupThe rule applies only to alerts from the specified resource groups. For example, you can use this filter with Does not equal to exclude one or more resource groups when the rule's scope is a subscription.
Resource typeThe rule applies only to alerts on resources from the specified resource types, such as virtual machines. You can use Equals to match one or more specific resources. You can also use Contains to match a resource type and all its child resources. For example, use resource type contains "MICROSOFT.SQL/SERVERS" to match both SQL servers and all their child resources, like databases.
SeverityThe rule applies only to alerts with the selected severities.

Alert processing rule filters

  • If you define multiple filters in a rule, all the rules apply. There's a logical AND between all filters.
    For example, if you set both resource type = "Virtual Machines" and severity = "Sev0", then the rule applies only for Sev0 alerts on virtual machines in the scope.
  • Each filter can include up to five values. There's a logical OR between the values.
    For example, if you set description contains "this, that" (in the field there is no need to write the apostrophes), then the rule applies only to alerts whose description contains either "this" or "that".
  • Notice that you dont have any spaces (before, after or between) the string that is matched it will effect the matching of the filter.

What should this rule do?

Choose one of the following actions:

  • Suppression: This action removes all the action groups from the affected fired alerts. So, the fired alerts won't invoke any of their action groups, not even at the end of the maintenance window. Those fired alerts will still be visible when you list your alerts in the portal, Azure Resource Graph, API, or PowerShell. The suppression action has a higher priority over the Apply action groups action. If a single fired alert is affected by different alert processing rules of both types, the action groups of that alert will be suppressed.
  • Apply action groups: This action adds one or more action groups to the affected fired alerts.

When should this rule apply?

You can control when the rule will apply. The rule is always active, by default. You can select a one-time window for this rule to apply, or you can have a recurring window, such as a weekly recurrence.

Configure an alert processing rule

You can access alert processing rules by going to the Alerts home page in Azure Monitor. Then you can select Alert processing rules to see and manage your existing rules. You can also select Create > Alert processing rules to open the new alert processing rule wizard.

Screenshot that shows how to access alert processing rules from the Azure Monitor landing page.

Let's review the new alert processing rule wizard.

  1. On the Scope tab, you select which fired alerts are covered by this rule. Pick the scope of resources whose alerts will be covered. You can choose multiple resources and resource groups, or an entire subscription. You can also optionally add filters, as previously described.

    Screenshot that shows the Scope tab of the alert processing rules wizard.

  2. On the Rule settings tab, you select which action to apply on the affected alerts. Choose between Suppress notifications or Apply action group. If you choose Apply action group, you can select existing action groups by selecting Add action groups. You can also create a new action group.

    Screenshot that shows the Rule settings tab of the alert processing rules wizard.

  3. On the Scheduling tab, you select an optional schedule for the rule. By default, the rule works all the time, unless you disable it. You can set it to work On a specific time, or you can set up a Recurring schedule.

    Let's see an example of a schedule for a one-time, overnight, planned maintenance. It starts in the evening and continues until the next morning, in a specific time zone.

    Screenshot that shows the Scheduling tab of the alert processing rules wizard with a one-time rule.

    An example of a more complex schedule covers an "outside of business hours" case. It has a recurring schedule with two recurrences. One recurrence is daily from the afternoon until the morning. The other recurrence is weekly and covers full days for Saturday and Sunday.

    Screenshot that shows the Scheduling tab of the alert processing rules wizard with a recurring rule.

  4. On the Details tab, you give this rule a name, pick where it will be stored, and optionally add a description for your reference.

  5. On the Tags tab, you can optionally add tags to the rule.

  6. On the Review + create tab, you can review and create the alert processing rule.

Manage alert processing rules

You can view and manage your alert processing rules from the list view:

Screenshot that shows the list view of alert processing rules.

From here, you can enable, disable, or delete alert processing rules at scale by selecting the checkboxes next to them. Selecting an alert processing rule opens it for editing. You can enable or disable the rule on the Details tab.