Microsoft Connected Cache for Internet Service Providers (early preview)
Overview
Microsoft Connected Cache (MCC) preview is a software-only caching solution that delivers Microsoft content within operator networks. MCC can be deployed to as many physical servers or VMs as needed and is managed from a cloud portal. Microsoft cloud services handle routing of consumer devices to the cache server for content downloads.
Microsoft Connected Cache is a hybrid application, in that it's a mix of on-premises and cloud resources. It's composed of a Docker-compatible Linux container deployed to your server and a cloud management portal. Microsoft chose Azure IoT Edge as a secure and reliable control plane. For more information on IoT Edge, see the Appendix. Even though your scenario isn't related to IoT, Azure IoT Edge is our secure Linux container deployment and management infrastructure.
How MCC works
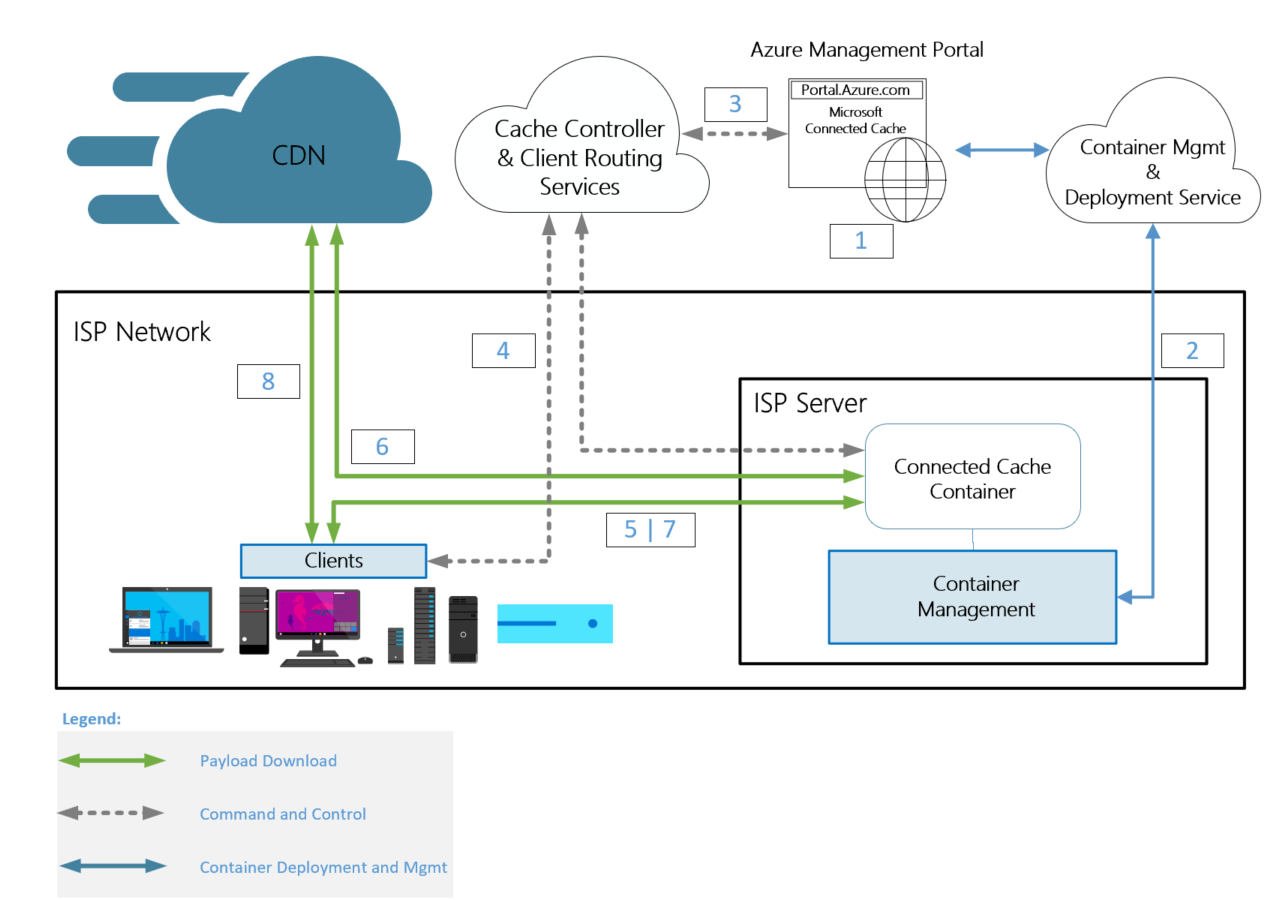
The following steps describe how MCC is provisioned and used:
The Azure Management Portal is used to create and manage MCC nodes.
A shell script is used to provision the server and deploy the MCC application.
A combination of the Azure Management Portal and shell script is used to configure Microsoft Delivery Optimization Services to route traffic to the MCC server.
The publicly accessible IPv4 address of the server is configured on the portal.
Manual Routing: Providing the CIDR blocks that represent the client IP address space, which should be routed to the MCC node.
BGP Routing: A shell script is used to initiate a peering session with a router in the operator network, and the operator initiates a session with the MCC node.
Note
Only IPv4 addresses are supported at this time. Entering IPv6 addresses will result in an error.
Microsoft end-user devices (clients) periodically connect with Microsoft Delivery Optimization Services, and the services match the IP address of the client with the IP address of the corresponding MCC node.
Microsoft clients make the range requests for content from the MCC node.
An MCC node gets content from the CDN, seeds its local cache stored on disk, and delivers the content to the client.
Subsequent requests from end-user devices for content will be served from cache.
If the MCC node is unavailable, the client gets content from the CDN to ensure uninterrupted service for your subscribers.
ISP requirements for MCC
Microsoft Connected Cache for Internet Service Providers is now in Public Preview! To get started, visit Azure portal to sign up for Microsoft Connected Cache for Internet Service Providers. Please see Operator sign up and service onboarding for Microsoft Connected Cache for more information on the requirements for sign up and onboarding.
Verify properly functioning MCC server
Verify client side
Sign in to the Connected Cache server or use SSH. Run the following command from a terminal to see the running modules (containers):
sudo iotedge list
If it lists the edgeAgent and edgeHub containers, but doesn't include MCC, view the status of the IoT Edge security manager using the command:
sudo journalctl -u iotedge -f
For example, this command provides the current status of the starting and stopping of a container, or the container pull and start:
Verify server side
It can take a few minutes for the container to deploy.
To validate a properly functioning MCC, run the following command in the terminal of the cache server or any device in the network. Replace <CacheServerIP> with the IP address of the cache server.
wget http://<CacheServerIP>/mscomtest/wuidt.gif?cacheHostOrigin=au.download.windowsupdate.com
The following screenshot shows a successful test result:
Similarly, enter the following URL into a web browser on any device on the network:
http://<CacheServerIP>/mscomtest/wuidt.gif?cacheHostOrigin=au.download.windowsupdate.com
If the test fails, for more information, see the common issues section.
Common Issues
Microsoft Connected Cache is no longer serving traffic
If you did not migrate your cache node then your cache node may still be on early preview version. Microsoft Connected Cache for Internet Service Providers is now in Public Preview! To get started, visit Azure portal to sign up for Microsoft Connected Cache for Internet Service Providers. Please see Operator sign up and service onboarding for Microsoft Connected Cache for more information on the requirements for sign up and onboarding.
Use the following command to check the IoT Edge journal:
DNS needs to be configured
Run the following IoT Edge install state check:
If you see issues with ports 5671, 443, and 8883, your IoT Edge device needs to update the DNS for Docker.
To configure the device to work with your DNS, use the following steps:
Use
ifconfigto find the appropriate NIC adapter name.BashifconfigRun
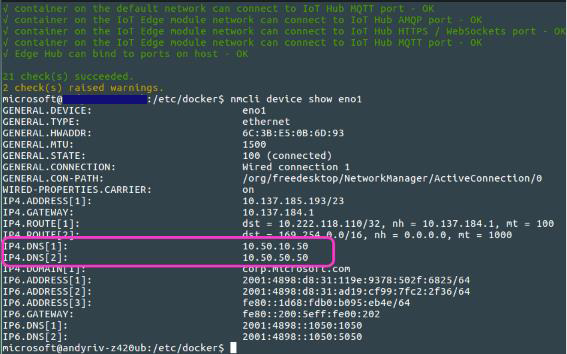
nmcli device show <network adapter name>to show the DNS name for the ethernet adapter. For example, to show DNS information for eno1:Bashnmcli device show eno1Open or create the Docker configuration file used to configure the DNS server.
Bashsudo nano /etc/docker/daemon.jsonPaste the following string into the daemon.json file, and include the appropriate DNS server address. For example, in the previous screenshot,
IP4.DNS[1]is10.50.10.50.Bash{ "dns": ["x.x.x.x"]}Save the changes to daemon.json. If you need to change permissions on this file, use the following command:
Bashsudo chmod 555 /etc/docker/daemon.jsonRestart Docker to pick up the new DNS setting. Then restart IoT Edge.
Bashsudo systemctl restart docker sudo systemctl daemon-reload sudo restart IoTEdge
Uninstalling MCC
In the installer zip file, you'll find the file uninstallmcc.sh. This script uninstalls MCC and all the related components. Before you run this script, contact the MCC team. Only run it if you're facing issues with MCC installation.
The uninstallmcc.sh script removes the following components:
- IoT Edge
- Edge Agent
- Edge Hub
- MCC
- Moby CLI
- Moby engine
To run the script, use the following commands:
Appendix
Steps to obtain an Azure subscription ID
- Sign in to the Azure portal.
- Select Subscriptions. If you don't see Subscriptions, type Subscriptions in the search bar. As you begin typing, the list filters based on your input.
- If you already have an Azure Subscription, skip to step 5. If you don't have an Azure Subscription, select + Add on the top left.
- Select the Pay-As-You-Go subscription. You'll be asked to enter credit card information, but you'll not be charged for using the MCC service.
- On the Subscriptions page, you'll find details about your current subscription. Select the subscription name.
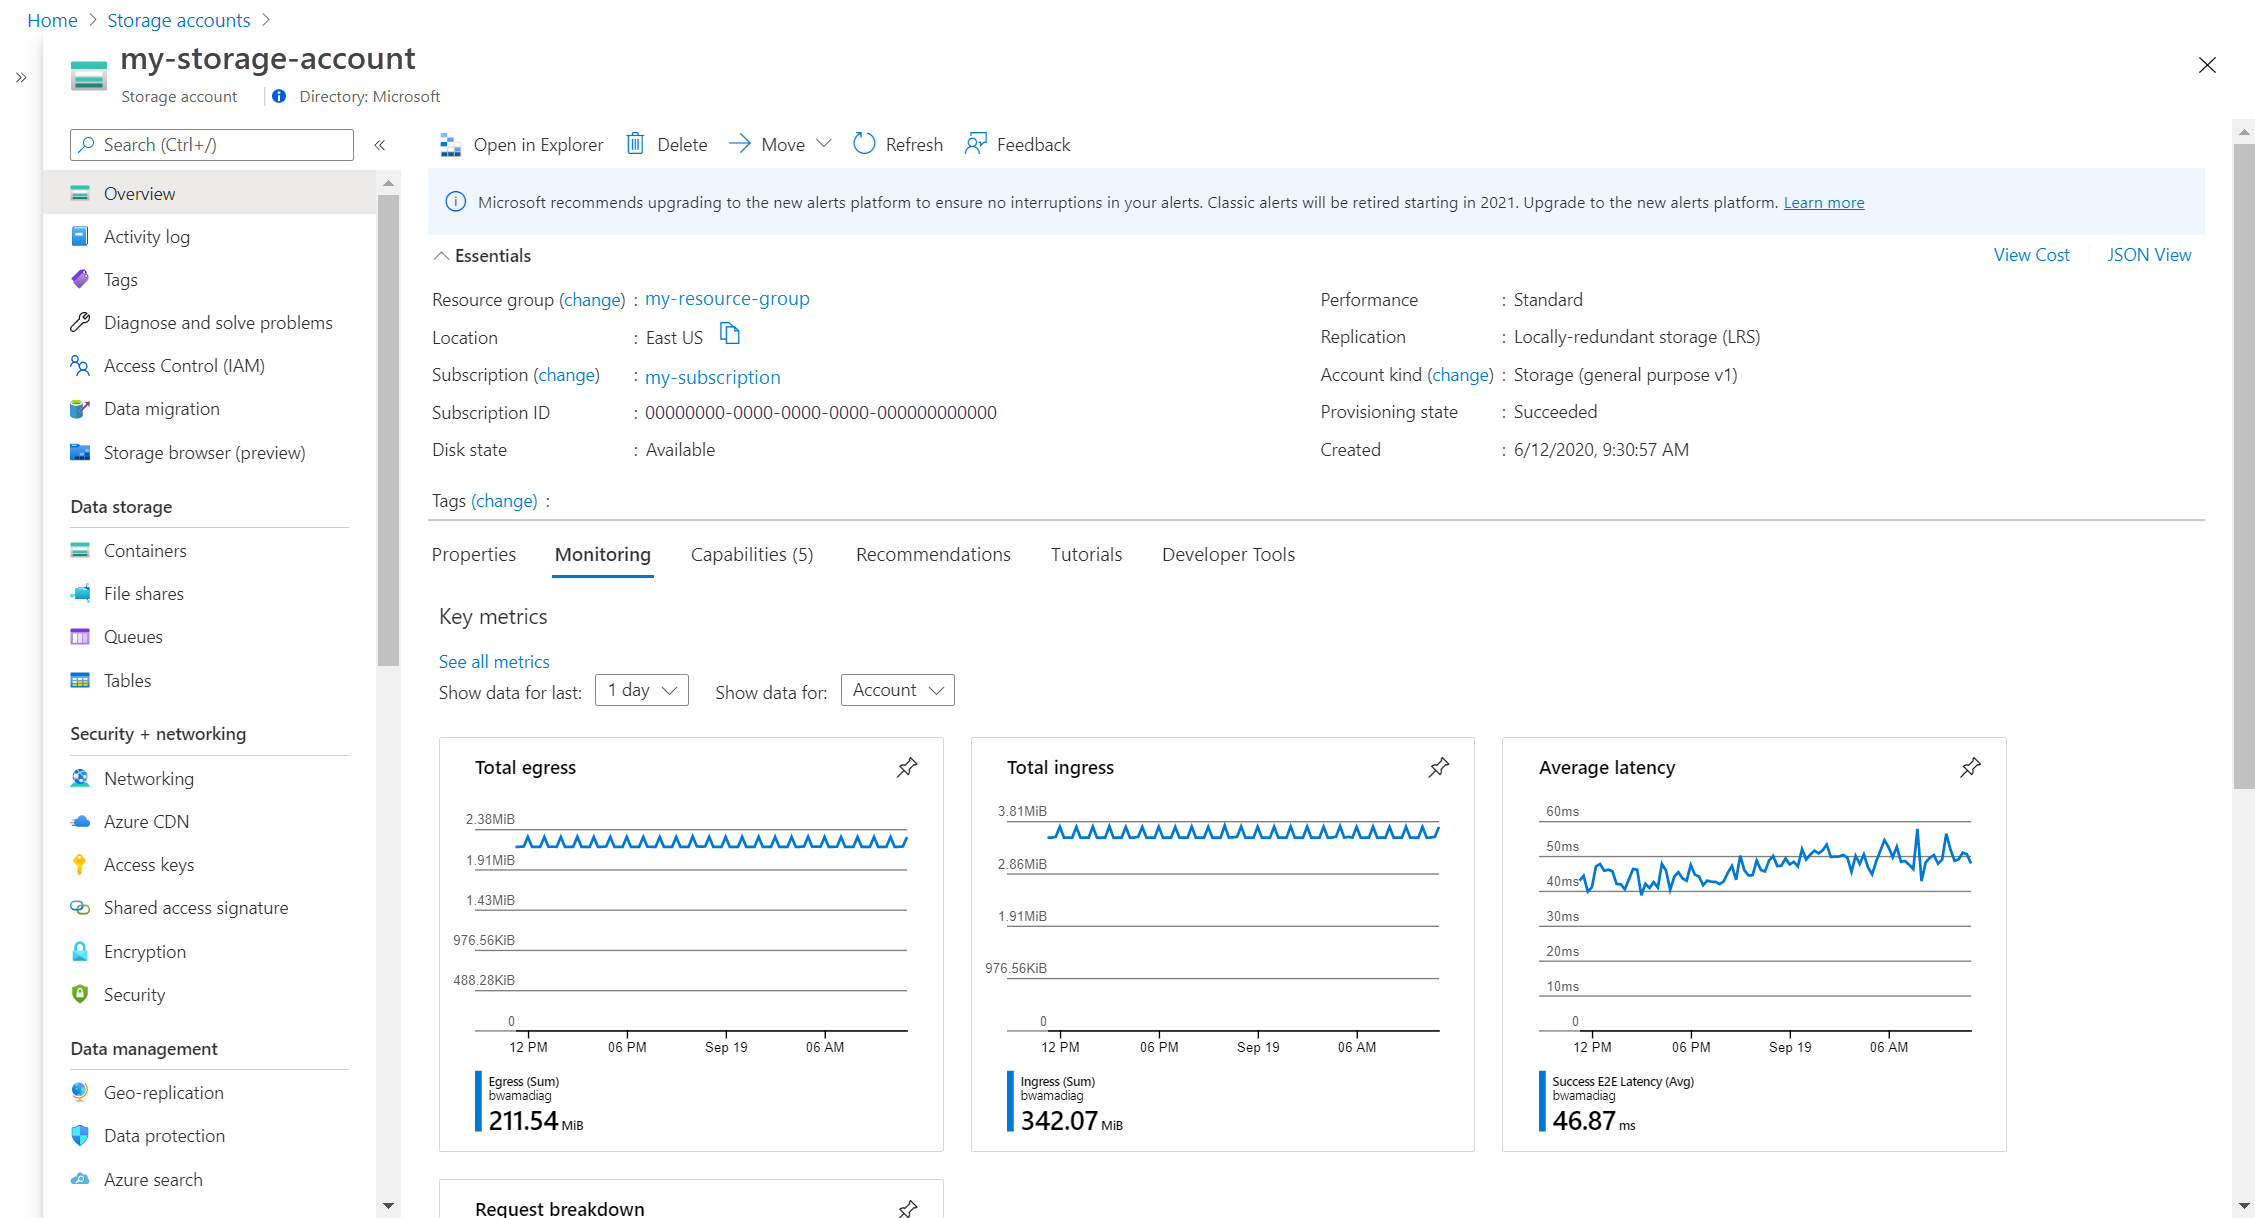
- After you select the subscription name, you'll find the subscription ID in the Overview tab. Select the Copy to clipboard icon next to your Subscription ID to copy the value.
Performance of MCC in virtual environments
In virtual environments, the cache server egress peaks at around 1.1 Gbps. If you want to maximize the egress in virtual environments, it's critical to change the following two settings:
Enable SR-IOV in the following three locations:
- The BIOS of the MCC VM
- The MCC VM's network card properties
- The hypervisor for the MCC VM
Microsoft has found these settings to double egress when using a Microsoft Hyper-V deployment.
Enable "high performance" in the BIOS instead of energy savings. Microsoft has found this setting nearly doubled egress in a Microsoft Hyper-V deployment.
Grant other users access to manage your MCC
More users can be given access to manage Microsoft Connected Cache, even if they don't have an Azure account. Once you've created the first cache node in the portal, you can add other users as Owners of the Microsoft Connected Cache resource group and the Microsoft Connected Cache resource.
For more information on how to add other users as an owner, see Grant a user access to Azure resources using the Azure portal. Make sure to do this action for both the MCC resource and MCC resource group.
Setting up a VM on Windows Server
You can use hardware that will natively run Ubuntu 20.04 LTS, or you can run an Ubuntu VM. The following steps describe how to set up a VM on Hyper-V.
Download the ISO. You can use either Ubuntu Desktop or Ubuntu Server.
Start the New Virtual Machine Wizard in Hyper-V.
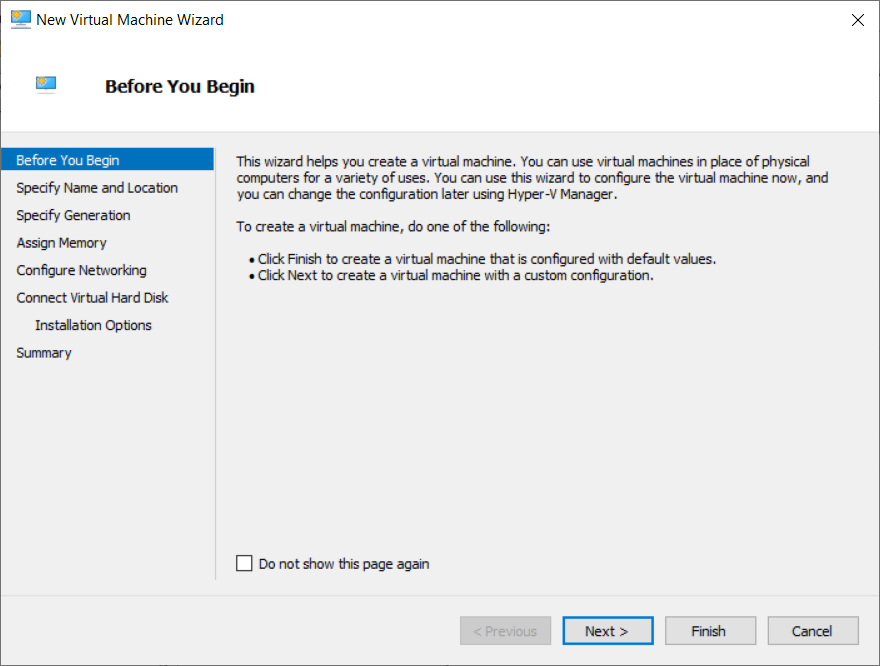
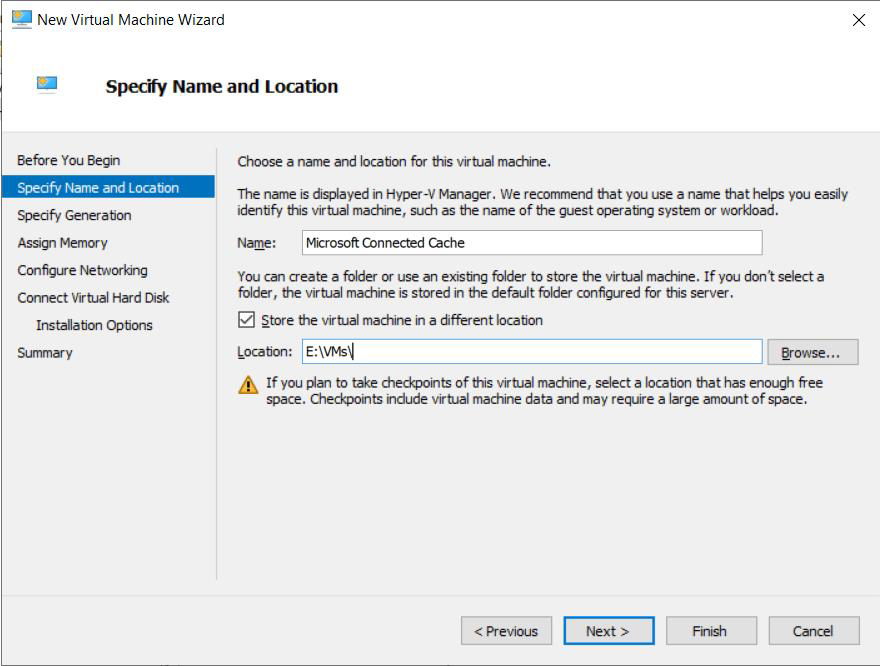
Specify a name and choose a location.
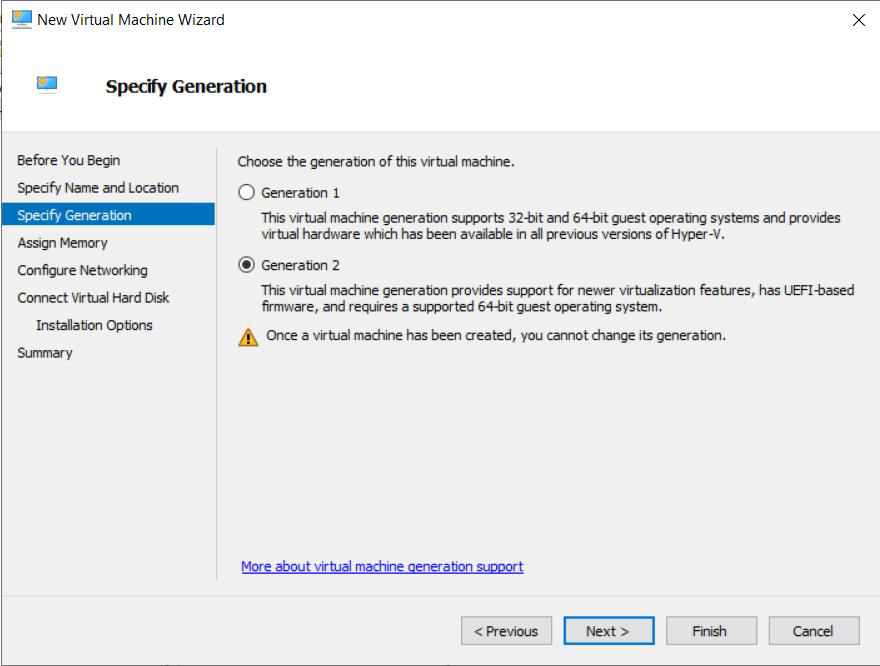
Select Generation 2. You can't change this setting later.
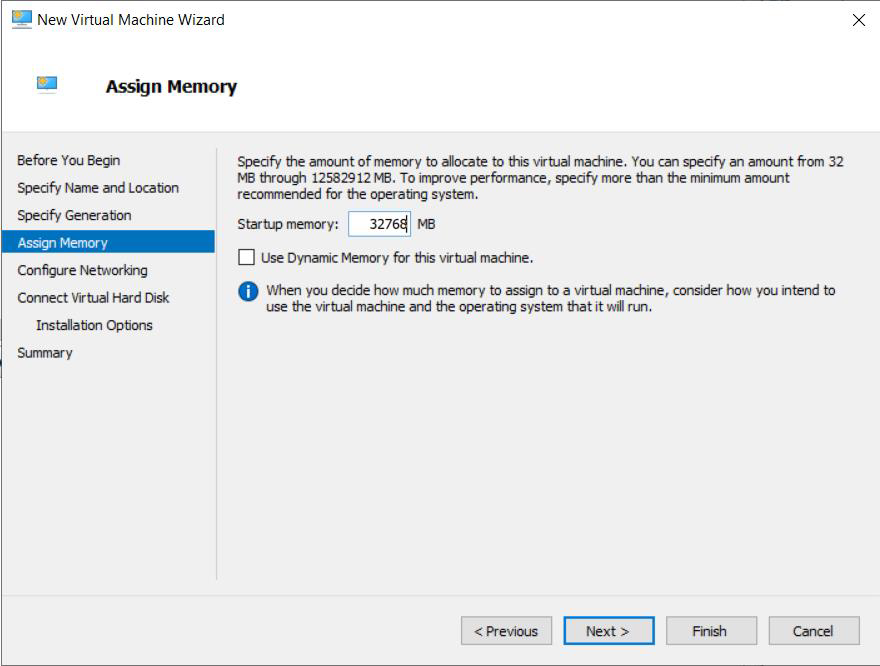
Specify the startup memory.
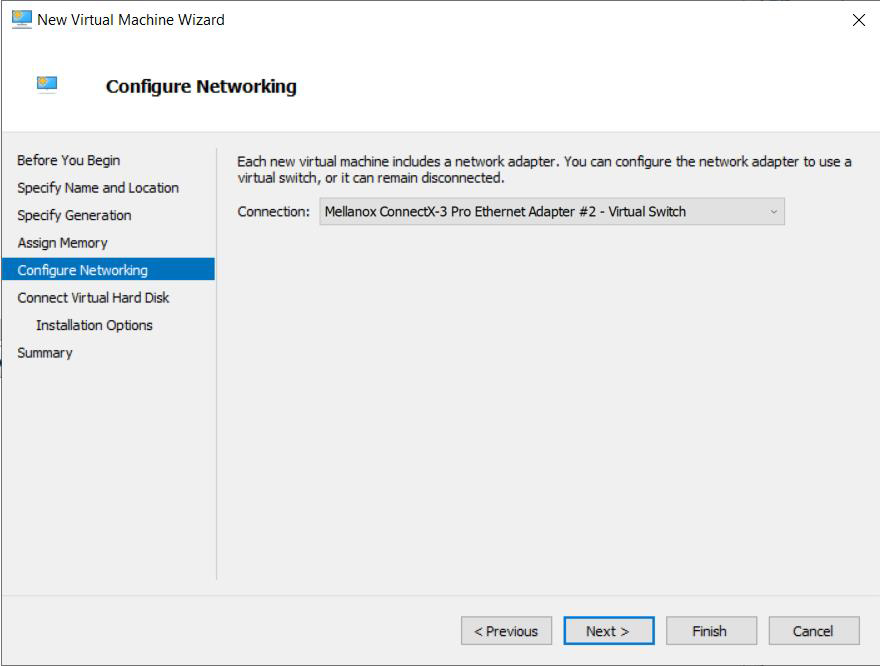
Choose the network adapter connection.
Set the virtual hard disk parameters. You should specify enough space for the OS and the content that will be cached. For example,
1024GB is 1 terabyte.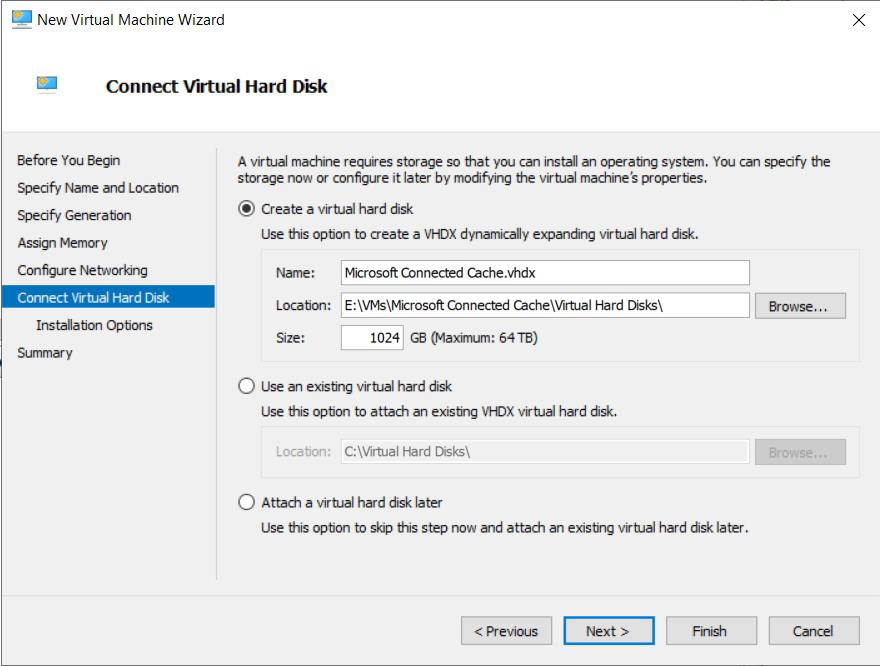
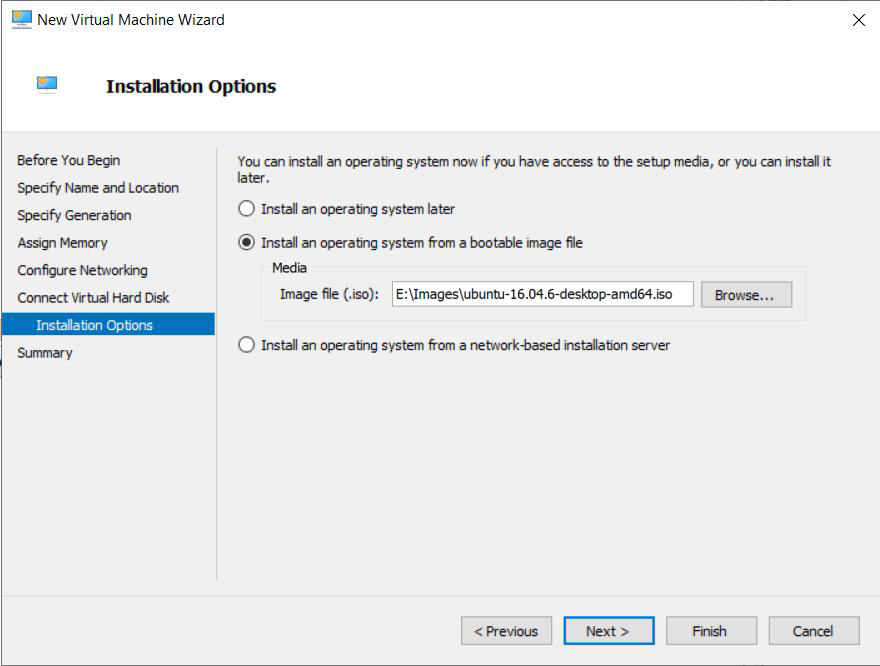
Select Install an OS from a bootable image file and browse to the ISO for Ubuntu 20.04 LTS that you previously downloaded.
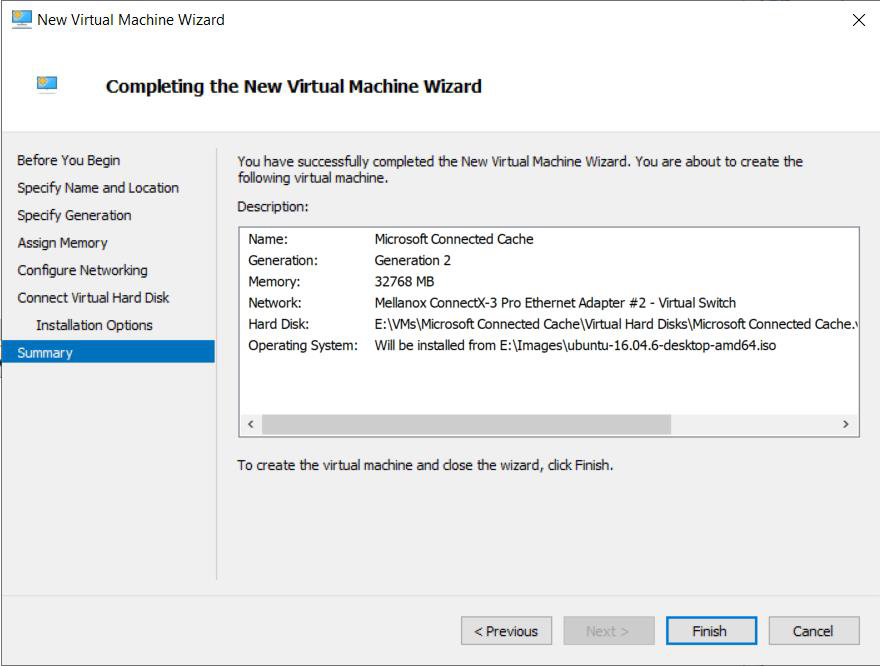
Review the settings and select Finish to create the Ubuntu VM.
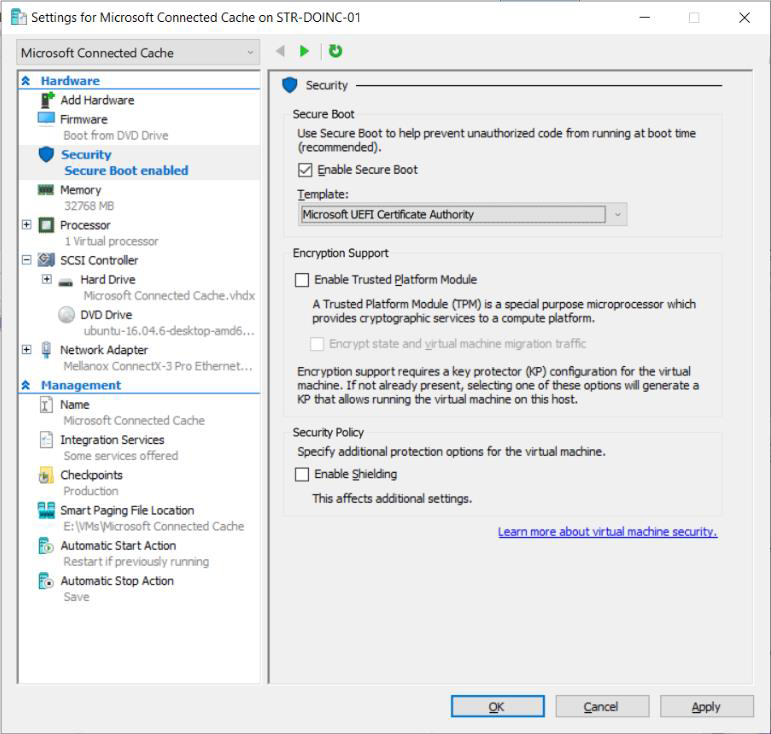
Before you start the Ubuntu VM, disable Secure Boot and allocate multiple cores to the VM.
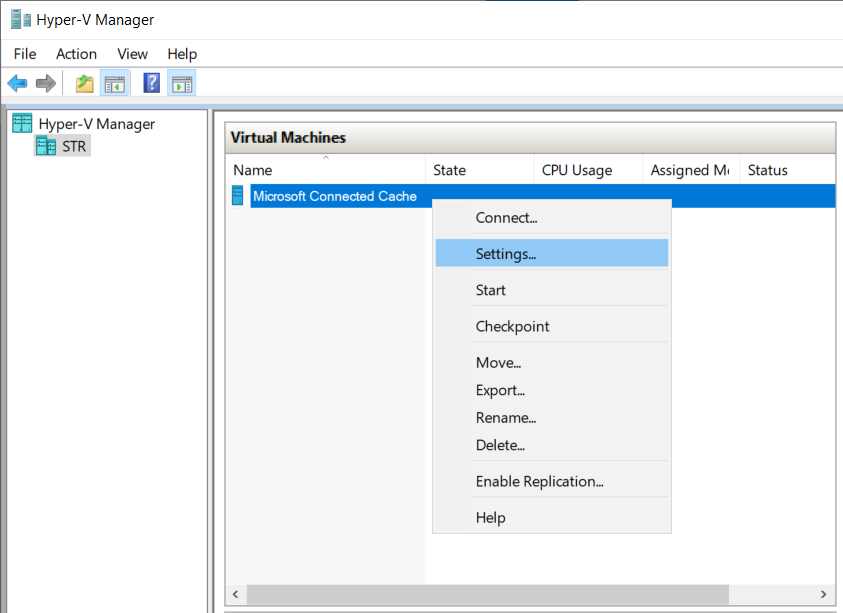
In Hyper-V Manager, open the Settings for the VM.
Select Security. Disable the option to Enable Secure Boot.
Select Processor. Increase the number of virtual processors. This example shows
12, but your configuration may vary.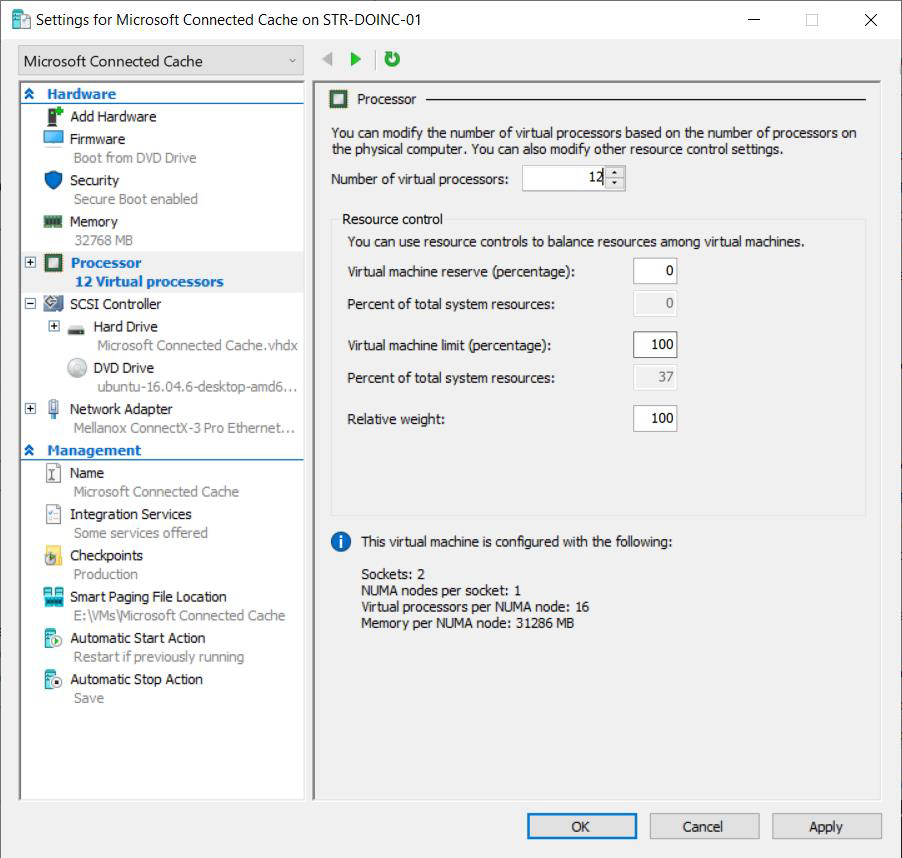
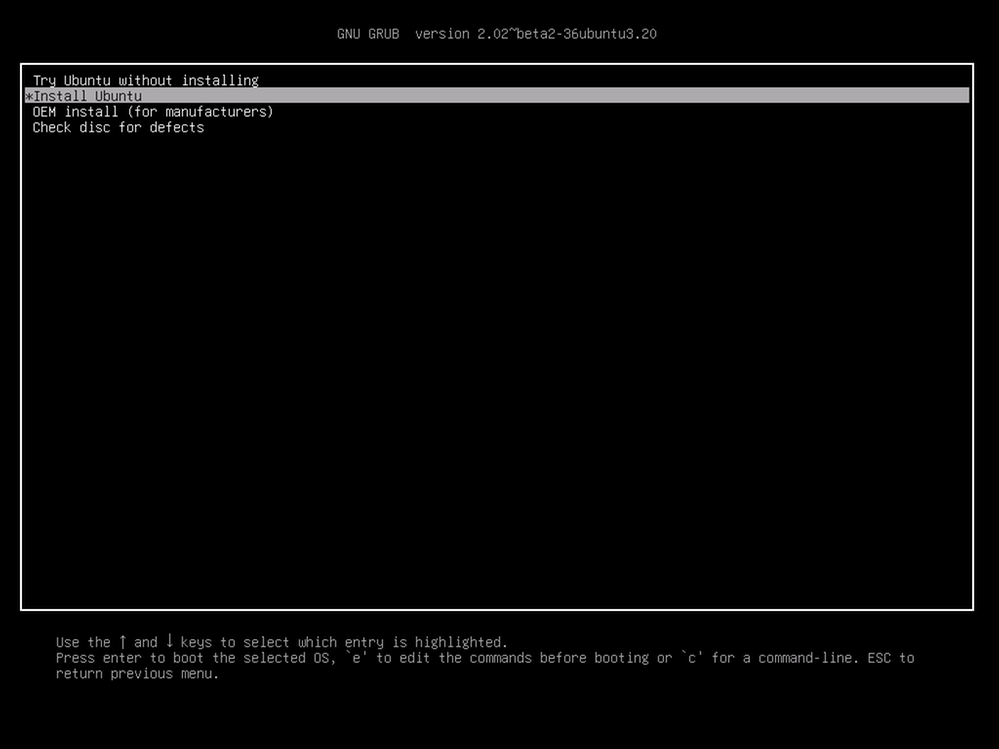
Start the VM and select Install Ubuntu.
Choose your default language.
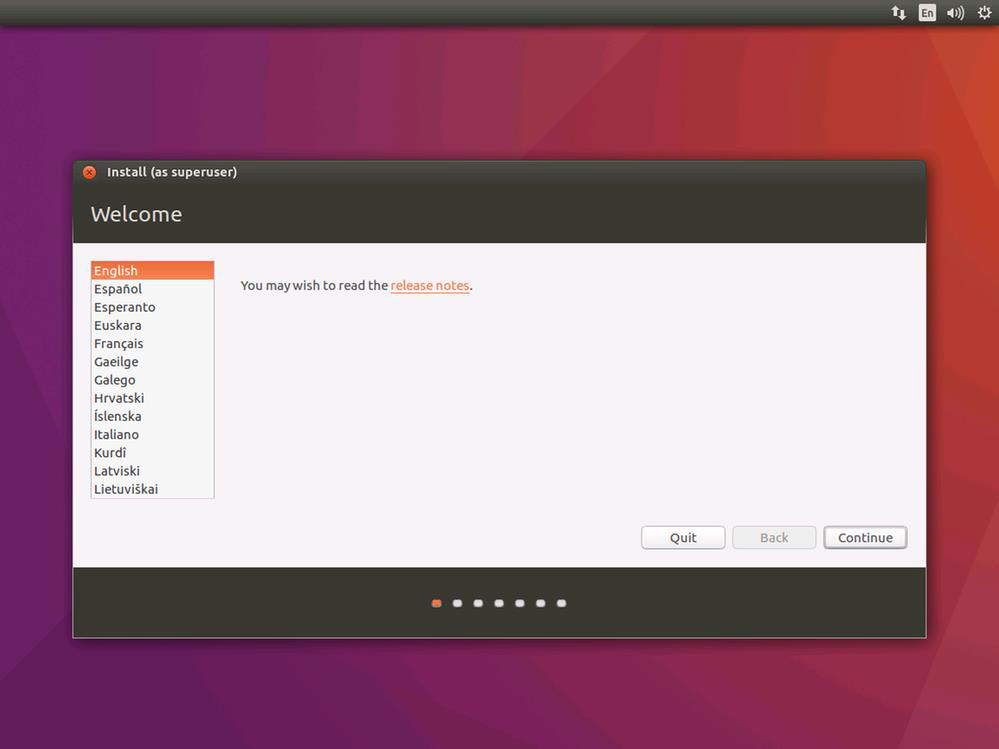
Choose the options for installing updates and third party hardware. For example, download updates and install third party software drivers.
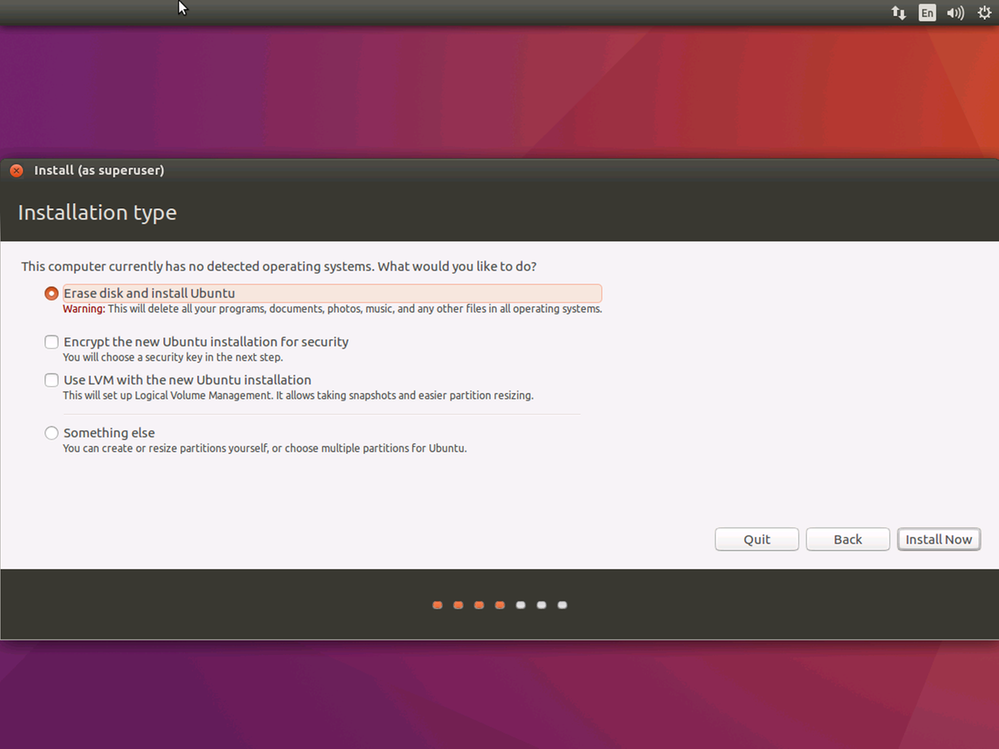
Select Erase disk and install Ubuntu. If you had a previous version of Ubuntu installed, we recommend erasing and installing Ubuntu 16.04.
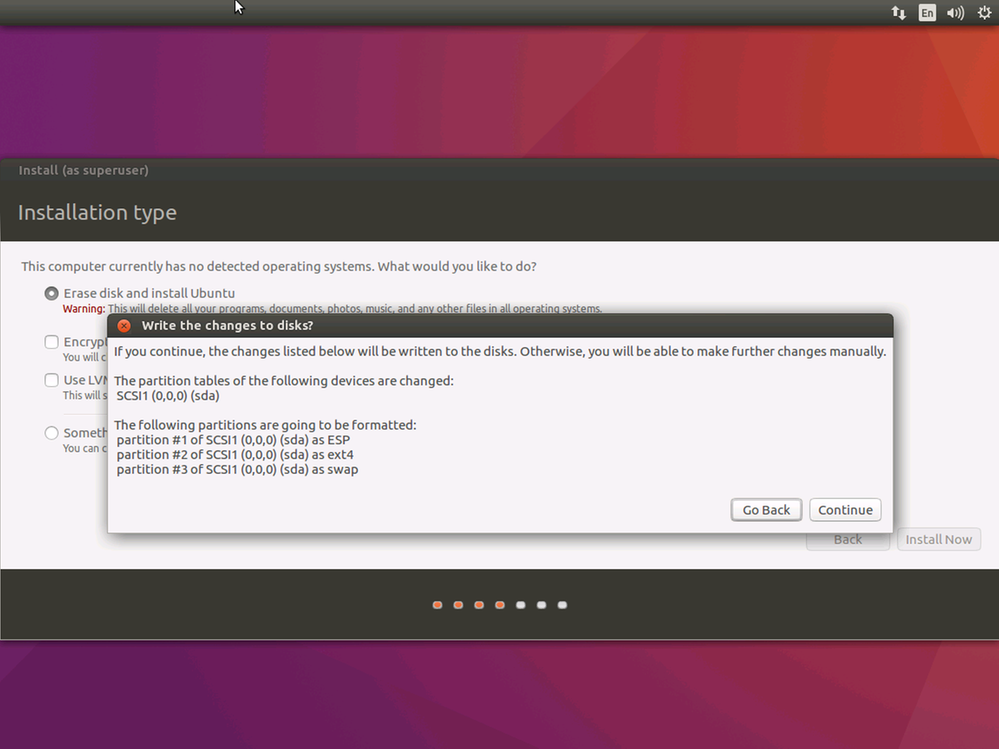
Review the warning about writing changes to disk, and select Continue.
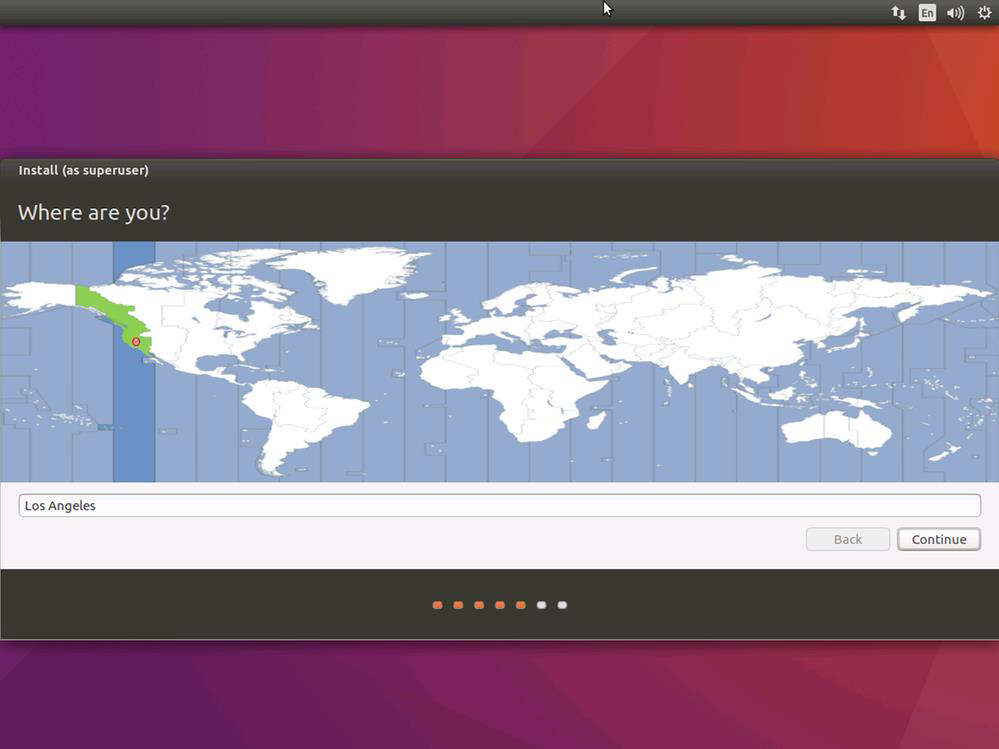
Choose the time zone.
Choose the keyboard layout.
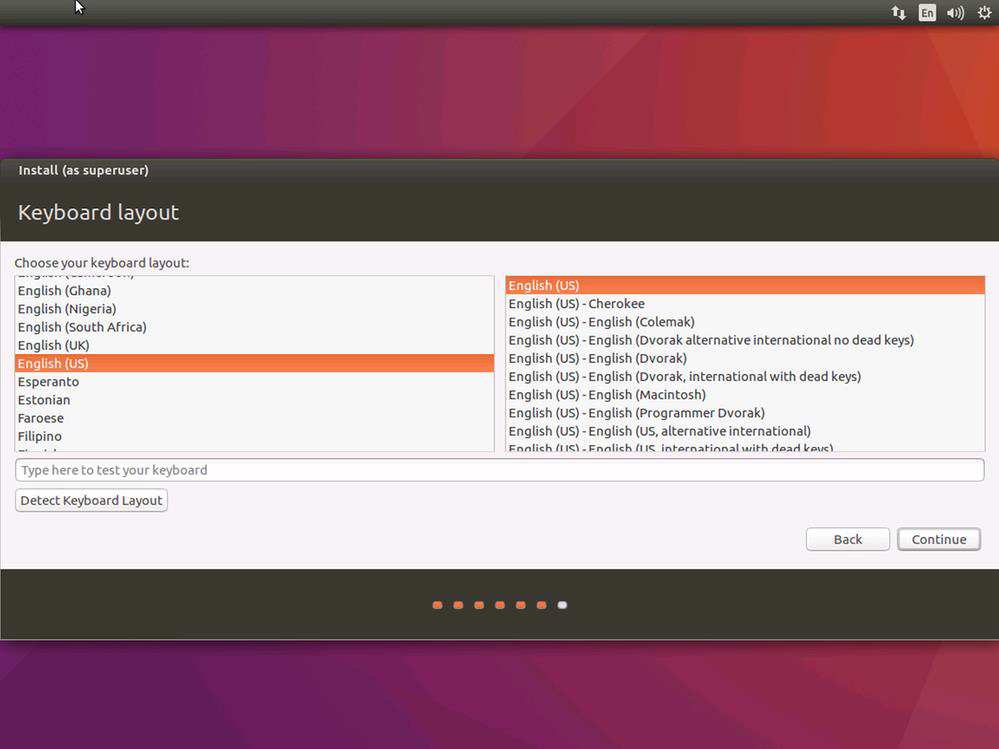
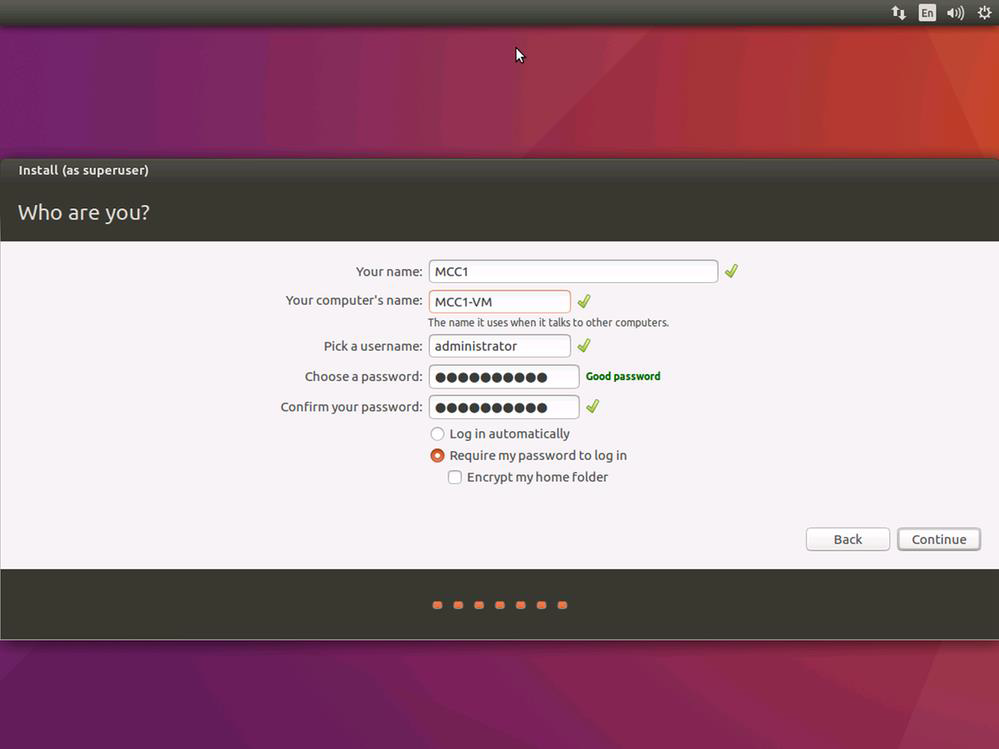
Specify your name, a name for the computer, a username, and a strong password. Select the option to Require my password to log in.
Tip
Everything is case sensitive in Linux.
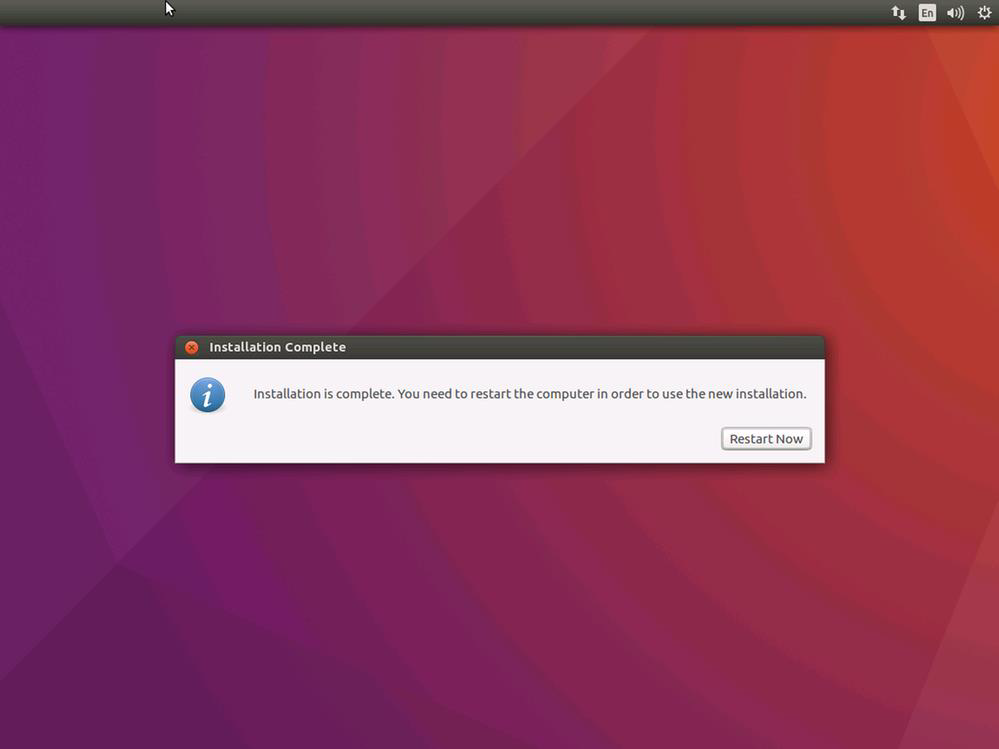
To complete the installation, select Restart now.
After the computer restarts, sign in with the username and password.
Important
If it shows that an upgrade is available, select Don't upgrade.
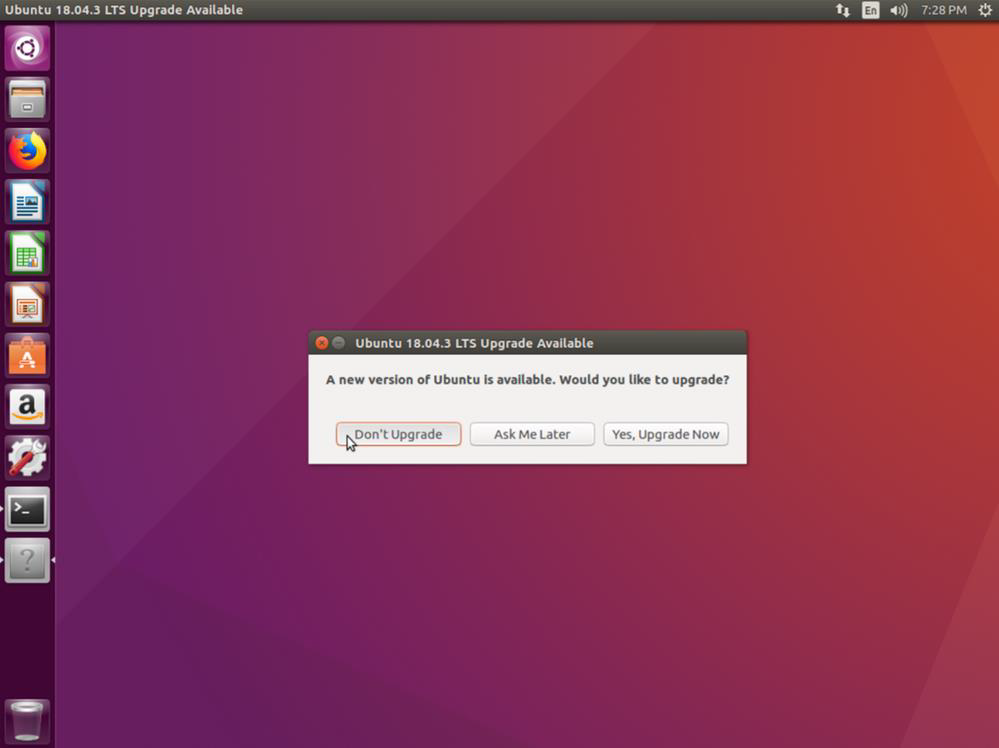
Your Ubuntu VM is now ready to install MCC.

