Linux Training in Coimbatore & Best Linux Server Administration Training Institute NUX SOFTWARE SOLUTIONS FREE DEMO CLASSES AVAILABLE Call us 096263 53489
Red Hat and Microsoft jointly engineer, operate, and support Azure Red Hat OpenShift. The table below summarizes the key benefits of Azure Red Hat OpenShift over OpenShift as IaaS. Azure OpenShift Benefits
Benefit
Description
Security
Enterprise-grade operations, security, and compliance. With SLA of 99.95% availability and PCI DSS, ISO 27001, HITRUST, SOC 2 Type II, and FedRAMP certifications.
Cloud-native Integrations
Promotes developer productivity with built-in CI/CD pipelines and effortlessly connects applications to hundreds of Azure services such as MySQL, PostgreSQL, Redis, Cosmos DB, etc.
Quick Startup
Start a highly available cluster quickly and scale your application demand changes.
Flexible Instance Types
Choice between standard, memory-optimized, and CPU-optimized application nodes.
Convenient Billing
Pay through an already configured Azure subscription.
Vertical Integration
A vertically integrated product with a core OS, so any updates or security vulnerabilities are addressed sooner and faster.
Azure OpenShift Cost
Azure OpenShift 4 has a minimum cluster size of three master nodes and three worker nodes. Both node types use Linux Azure VM pricing. Additionally, worker nodes have OpenShift license costs as well. With Azure OpenShift, these VM sizes are billed as part of the standard Azure subscription. Both master and worker nodes can use Azure's reduced on-demand and reserved instance pricing. For a complete list of supported VM sizes, see Azure Red Hat OpenShift pricing
Azure OpenShift Deployment Options
There are two ways to run OpenShift on Azure:
OpenShift Container Platform (OCP) deployed on a virtual machine
Azure Red Hat OpenShift deployed through Azure portal or Azure CLI.
OpenShift running on an Azure VM
OpenShift Container Platform on virtual machines is deployed through cloud.redhat.com/openshift. With this deployment model, OpenShift must be installed and set up on a VM, and you must bring your own license. There are no Azure-specific operations, integrations, or billing benefits in this case. With this option, using OpenShift on Azure is the same as running it on your own hardware or another infrastructure as a service (IaaS) platform like GCP or AWS.
Azure OpenShift
With this deployment model, you can deploy Azure Red Hat OpenShift through the Azure portal or the Azure CLI. It is fully managed and supported by both Red Hat and Azure. Since this is part of the Azure service stack, the billing integrates into your Azure subscription, including a license.
How to Deploy Azure OpenShift
Now, let’s walk through how you can deploy Azure Red Hat OpenShift using the Azure portal and Azure CLI.
Identify mis-sized containers at a glance & automate resizing
Get Optimal Node Configuration Recommendations
Kubernetes
Kubernetes + Densify
Prerequisites
Before we get started, you’ll need to:
Ensure Azure Red Hat is available in your region.
Make sure you have a pay-as-you-go Azure account, not a free entry-level account. The free version does not cover third-party license costs.
Have enough Azure quota for the standard dsv3 family of vCPUs.
Note that the initial quota allowed is ten vCPUs. You’ll need at least 40. Use the normal Azure process to request a large quota by going to the “Usage + quotas” option available under the Azure portal and requesting an additional quota for the instance type you will use to deploy the Azure OpenShift cluster. You can find a list of supported Quotas and other requirements for Azure OpenShift here.
Begin the process in the Red Hat OpenShift management console
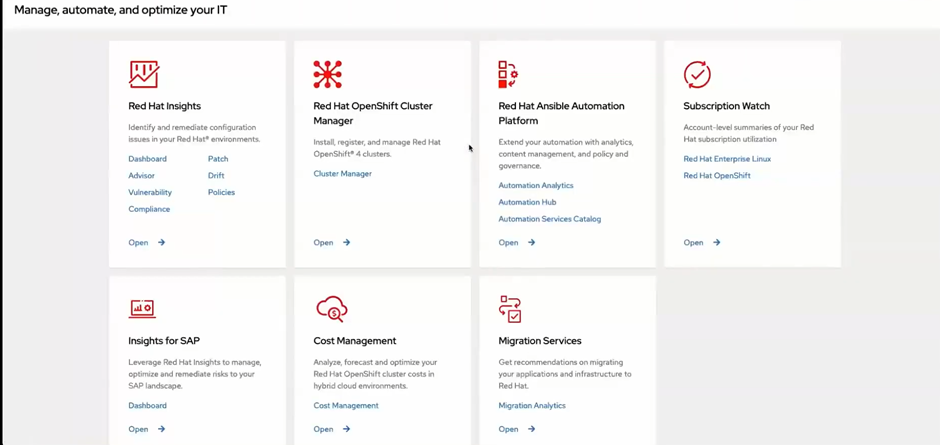
First, log in to your Red Hat OpenShift console using your Red Hat account at https://console.redhat.com/. Once logged in, you will find many options to interact with Red Hat software. The RedHat OpenShift console displays a variety of submenus.The RedHat OpenShift console displays a variety of submenus.
Select Red Hat OpenShift Cluster Manager.
Then click the "Create Cluster" which will display many different options to create a new cluster.
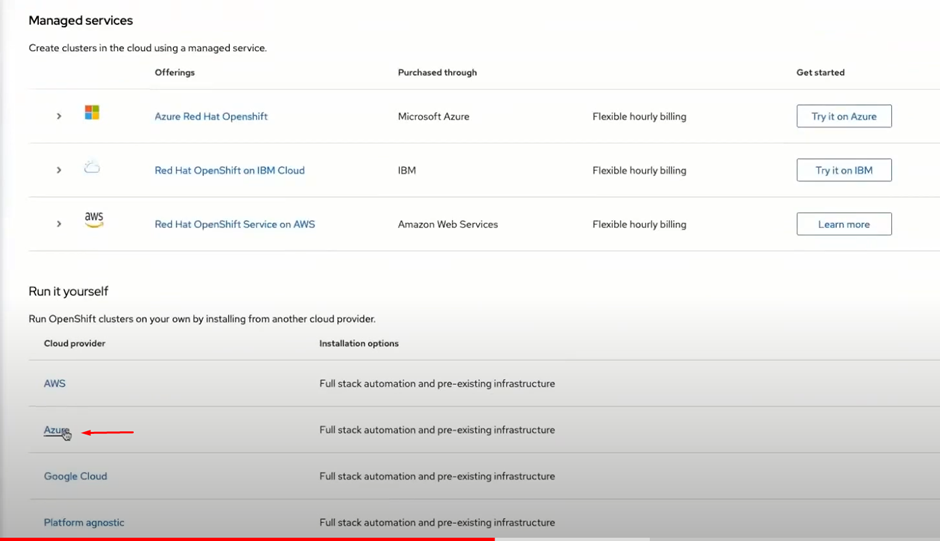
Click “Try it on Azure” for the Azure Red Hat OpenShift offering. You will see detailed instructions for quickly deploying a production-grade OpenShift cluster standing up on Azure. We’ll follow these instructions here.
Get your pull secret from the Red Hat management console for Azure to begin deployment. It is located under “Run it yourself” below the Managed services offering.The Red Hat management console displays several options for deploying OpenShift on different IaaS platforms.
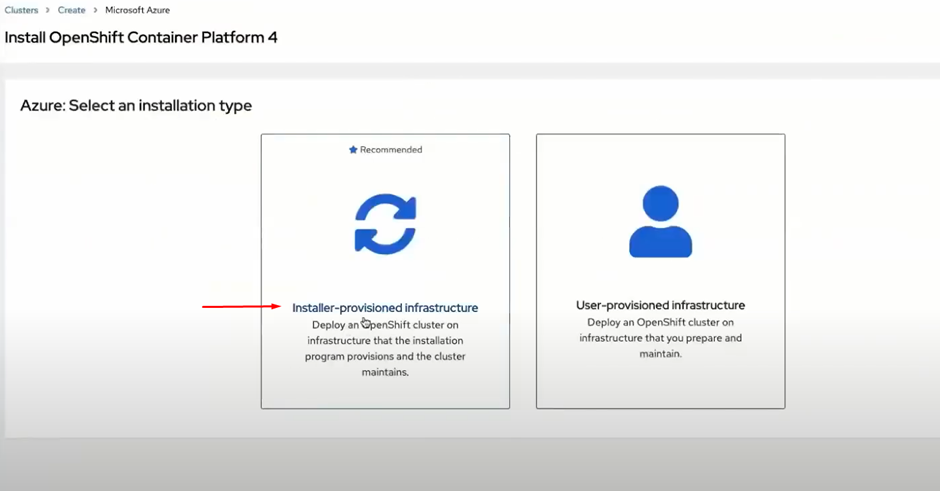
Choose the “Installer-provisioned infrastructure” option.The Red Hat management console provides two options for Azure OpenShift
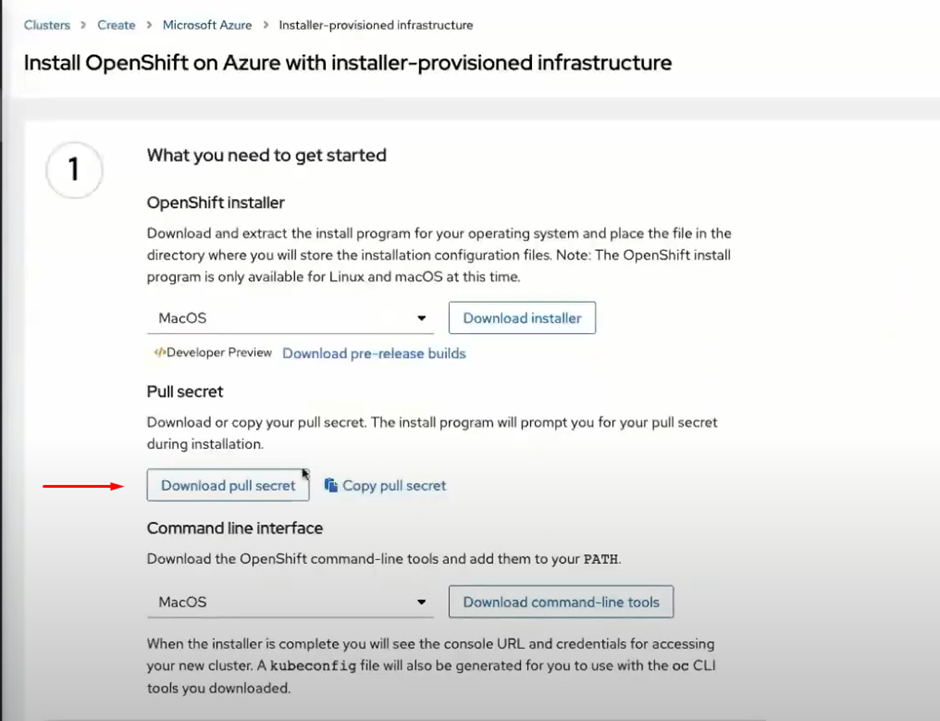
Click “Download pull secret” to download the pull secret. This step will save the pull secret to your local machine.The Red Hat management console allows users to download their pull secret.
Prep Azure for installation
Next, we’ll prep Azure for installation. We can also do this through the Azure portal, but for this article, we’ll use the Azure CLI as it makes deployment easier.
First, we need to register the Red Hat OpenShift resource on our subscription along with Microsoft’s compute, storage, and authorization resource providers. Run the following commands to register required resources:
    az provider register -n Microsoft.RedHatOpenShift –wait
    az provider register -n Microsoft.Compute –wait
    az provider register -n Microsoft.Storage –wait
    az provider register -n Microsoft.Authorization –wait
Next, run these commands to configure environment variables:
    LOCATION=eastus #location of your cluster
    RESOURCEGROUP=arorg #name of the resource group where you want to create your cluster
    CLUSTER=cluster #name of your cluster
Now, we’ll create a resource group with a location. Use these commands to create the group:
Note that in Azure, a resource group is a logical group in which Azure resources are deployed and managed. We have to set a location for this. This location is where the resource group metadata is stored and sets the default location for the resources created in this resource group. The resource created in a resource group is not limited to the location of the resource group.
Next, we’ll configure networking for our cluster. We will create a virtual network that will have two empty subnets. The first subnet will be for the control pane, and the other for the workers. We will build all this networking inside the resource group we created earlier. Run these commands to configure the cluster networking:
    az network vnet create
    --resource-group $RG
    --name arovnet
    --address-prefixes 20.0.0.0/22
After creating the virtual network, we need to create the two subnets we discussed earlier. We’ll also explicitly set a service endpoint, and that’s because Azure guarantees a secure and direct route when we do that. Use this command to create the master subnet:
Now, disable the subnet private endpoint policies for that master subnet. It is required for the service to be able to connect to and manage the cluster, and if we’re using the portal to do it, it would be the default. These are the CLI commands required.
Create a cluster using the aro create command. You can run this command to see the options available for the aro create command.
aro create –help | more
There are plenty of options available, including the ability to set the VM sizes, set up advanced network configuration, worker sizing, etc., to name a few. To create the cluster, run the commands below. It references the pull secret we downloaded earlier through the Red Hat management console.
    az aro create
      --resource-group $RESOURCEGROUP
      --name $CLUSTER
      --vnet arovnet
      --master-subnet mastersubnet
      --worker-subnet workersubnet
      --pull-secret @pull-secret.txt
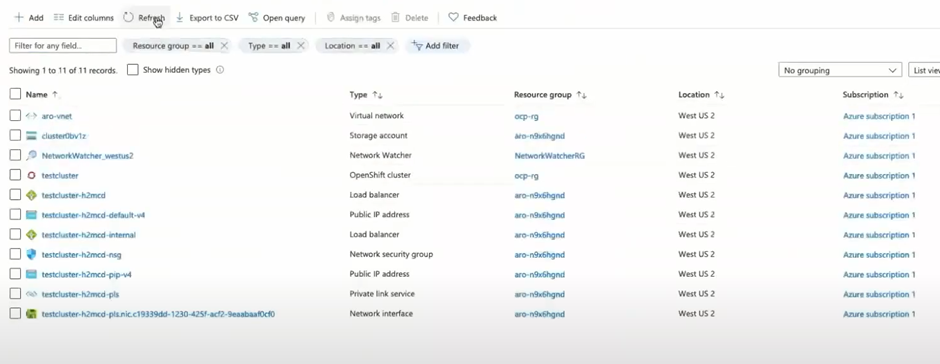
Installation typically takes around 30-35 minutes, depending on your region. You can watch the deployment progress on the Azure portal or through the debug command in CLI. When the installation completes, you’ll see the following list of resources deployed on your Azure, as shown in the screenshot below.Resources displayed in the Azure portal.
Once the cluster is reporting complete, we need to connect to it. Use this command to retrieve the credentials for the cluster:
    az aro list-credentials \
      --name $CLUSTER
      --resource-group $RG
Running this command retrieves the details for the cluster.
    az aro show
      --name $CLUSTER
      --resource-group $RG
      --query “consoleProfile.url” -o tsv
The output will include a URL to connect to the cluster we created.
Use the credentials extracted from the list-credentials command to log in to the Red Hat Management portal.
Pick the ideal instance type for your workload using an ML-powered visual catalog map
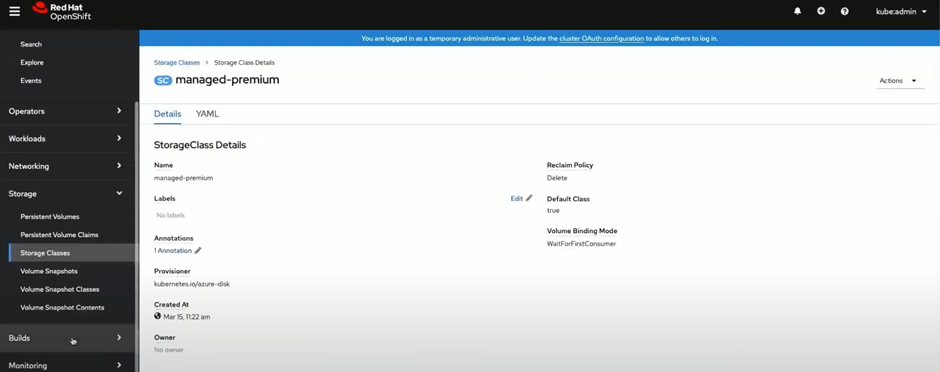
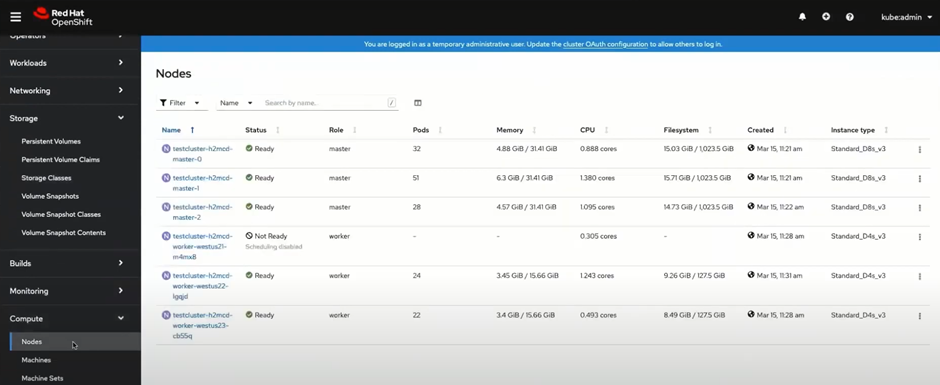
Now you have full cluster access for advanced customization and management. It also gives you complete control over upgrades and life cycle management.Storage classes are displayed in the Red Hat OpenShift management Portal.You also get direct access to Azure storage, compute, and auto-scaling options, among others.Azure-related options are displayed in the Red Hat OpenShift management Portal.
How to Configure Azure OpenShift Monitoring
Another excellent integration with Azure is being able to configure Azure RedHat OpenShift version 4 with container insight. After deployment, Azure Insights automatically displays the container. It is displayed under “Unmonitored clusters”, as shown in the screenshot below.A container is displayed in the “Unmonitored clusters” section of the Azure portal.
Running the install script and configuring monitoring
Microsoft provides a monitoring script that makes it very easy to enable monitoring. We start by setting up the resource id, resource group, and cluster name, with the command below:
After running the script, CLI will prompt you to grant access by authentication.
Go to the highlighted URL and enter the provided authentication code
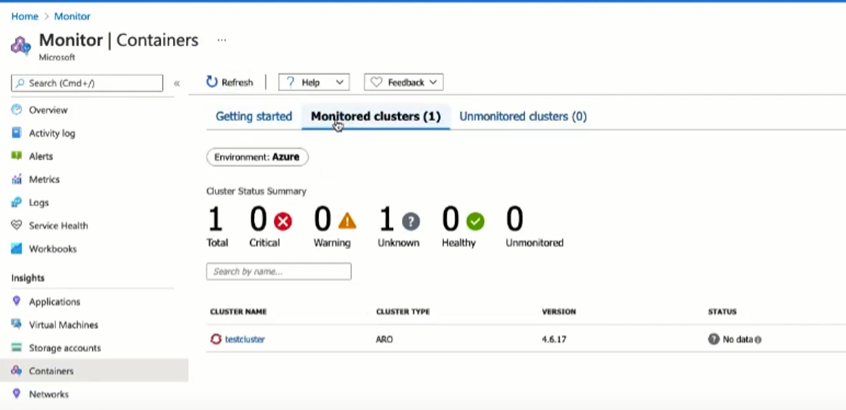
Once the script runs, the cluster will be under monitored clusters.A container is displayed in the “Monitored clusters” section of the Azure portal.
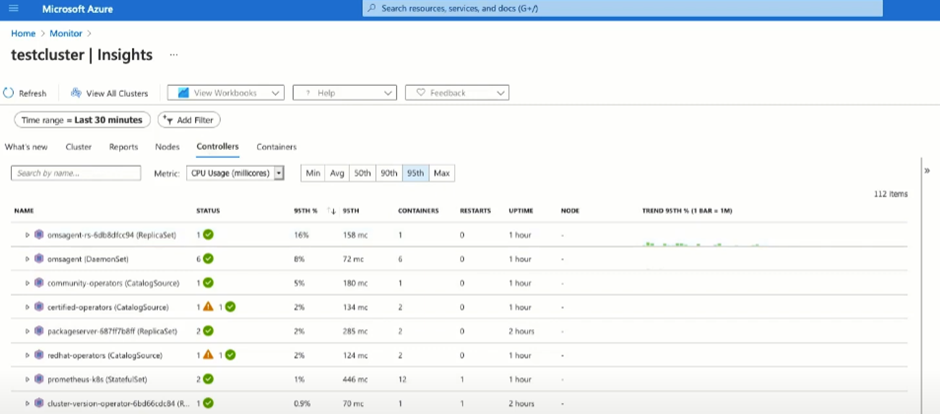
Click on the cluster name to access all the various configured dashboards. Depending on the deployment region, it will take around 5-10 minutes for the data to become available.
The Sumo Logic app for Azure Kubernetes Service (AKS) - Control Plane provides visibility into the AKS control plane with operational insights into the API server, scheduler, control manager, and worker nodes. The app's preconfigured dashboards display resource-related metrics for Kubernetes deployments, clusters, namespaces, pods, containers, and daemonsets.
Azure Kubernetes Service (AKS) is a Kubernetes environment with clusters managed by Azure. AKS simplifies deploying and managing container-based applications, while automatically provisioning, upgrading, and scaling resources as needed.
kube-apiserver - The API server exposes the underlying Kubernetes APIs. This component provides the interaction for management tools, such as kubectl or the Kubernetes dashboard.
kube-scheduler - The Scheduler determines what nodes can run the workload when you create or scale applications and then starts them.
kube-controller-manager - The Controller Manager oversees a number of smaller controllers that perform actions, such as replicating pods and handling node operations.
Collecting Logs for the Kubernetes and AKS - Control Plane
The Sumo Logic Kubernetes app works in conjunction with the AKS - Control Plane app and allows you to monitor worker node logs, as well as metrics for the Azure monitor and worker nodes.
Collecting logs and installing the Kubernetes app
The Sumo Logic Kubernetes app provides the services for managing and monitoring Kubernetes worker nodes. You must set up collection and install the Kubernetes app before configuring collection for the AKS - Control Plane app. You will configure log and metric collection during this process.
To set up collection and install the Kubernetes app, follow the instructions in this document.
When you configure the event hubs source, plan your source category to ease the querying process. A hierarchical approach allows you to make use of wildcards. For example: Azure/AKS/ControlPlane/Logs.
Enable the Kubernetes master node logs in Azure Kubernetes Service to send logs to an event hub created in the previous step.
Go to Kubernetes Services. Select your AKS cluster from which you want to collect logs.
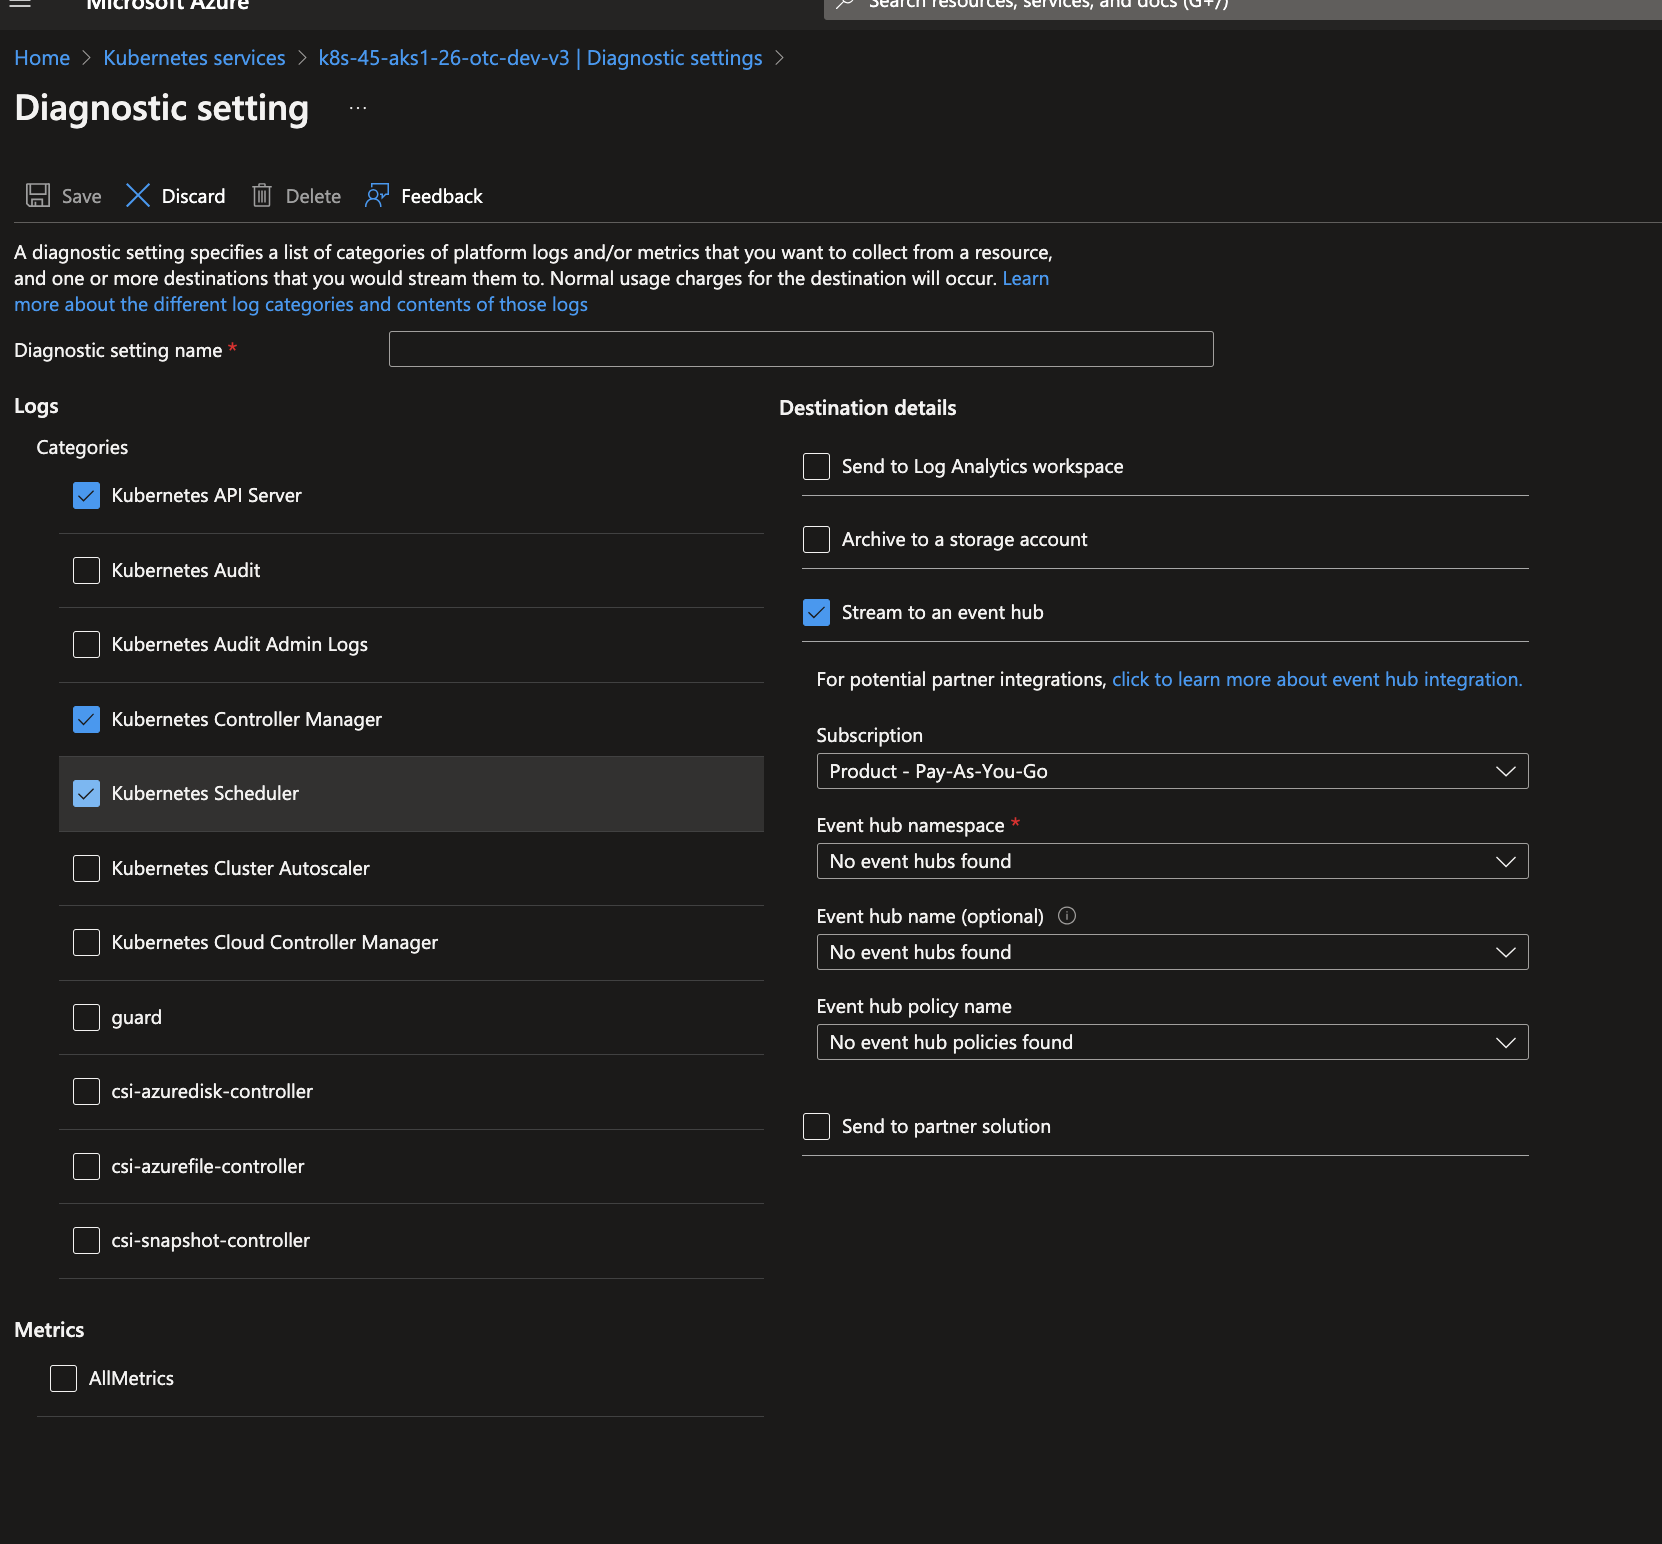
In the Monitoring Section, the Diagnostic Settings blade displays any existing settings. Click Edit Setting if you want to change your existing settings, or click Add diagnostic setting to add a new one. You can have a maximum of three settings.
Enter a name.
Check the Stream to an event hub box and click Event hub / Configure.
Select an Azure subscription.
Event bub namespace. If you have chosen Method 1 (Azure Event Hubs Source) for collecting logs, select the EventHubNamespace created manually, or else if you have chosen Method 2 (Collect logs from Azure monitor using Azure functions), then select SumoAzureLogsNamespace<UniqueSuffix> namespace created by the ARM template.
Event hub name (optional). If you have chosen Method 1 (Azure Event Hub Source) for collecting logs, select the event hub name, which you created manually, or if you have chosen Method 2 (Collect logs from Azure monitor using Azure functions), then select insights-operational-logs.
Select RootManageSharedAccessKey from Select event hub policy name dropdown.
Select the checkbox for log types under Categories which you want to ingest.
Now that you have set up collection for AKS, you can install the Sumo Logic app for AKS and access the pre-configured Kubernetes dashboards for visibility into your AKS environment from a single-pane-of-glass.
All the dashboards are linked to the Kubernetes views so they can be easily accessed by clicking the Cluster in the navigation pane of the tab.
To install the app:
Select App Catalog.
In the Search Apps field, search for and then select your app.
Optionally, you can scroll down to preview the dashboards included with the app. Then, click Install App (sometimes this button says Add Integration).
On the next configuration page, under Select Data Source for your App, complete the following fields:
Data Source. Select one of the following options:
Choose Source Category and select a source category from the list; or
Choose Enter a Custom Data Filter, and enter a custom source category beginning with an underscore. For example, _sourceCategory=MyCategory.
Folder Name. You can retain the existing name or enter a custom name of your choice for the app.
All Folders (optional). Default location is the Personal folder in your Library. If desired, you can choose a different location and/or click New Folder to add it to a new folder.
Click Next.
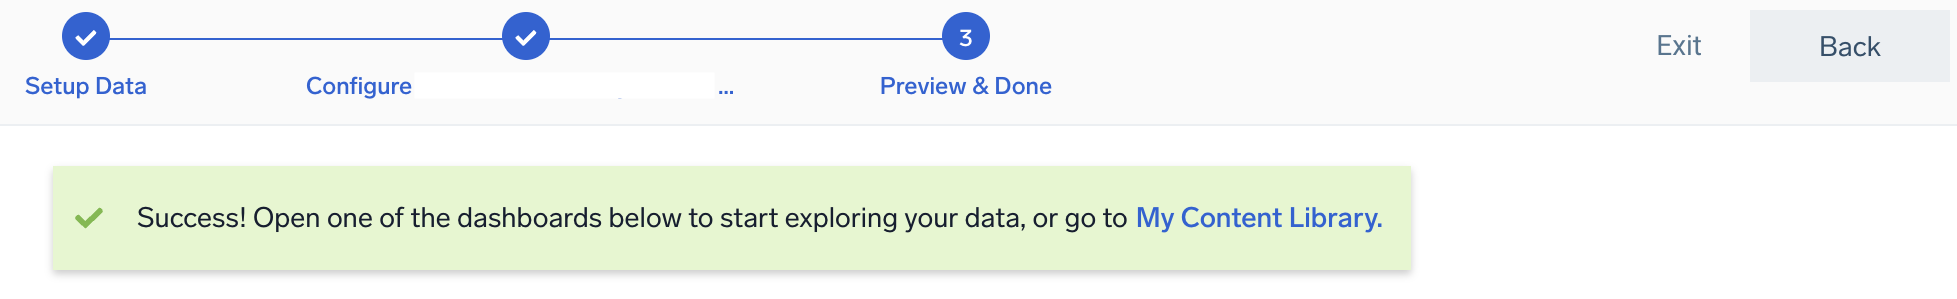
Look for the dialog confirming that your app was installed successfully.
Once an app is installed, it will appear in your Personal folder or the folder that you specified. From here, you can share it with other users in your organization. Dashboard panels will automatically start to fill with data matching the time range query received since you created the panel. Results won't be available immediately, but within about 20 minutes, you'll see completed graphs and maps.
Template variables provide dynamic dashboards that rescope data on the fly. As you apply variables to troubleshoot through your dashboard, you can view dynamic changes to the data for a fast resolution to the root cause. For more information, see the Filter with template variables page.
You can use template variables to drill down and examine the data on a granular level.
The AKS Controller Manager dashboard provides a high-level view of severity types and trends, along with details on scale operations, pod creation and deletion, and recent error messages.
Use this dashboard to:
Find pod and scale operations performed by controller manager.
Find the severity of various controller manager events and analyze fatal and erroneous controller manager operation events.
The AKS API Server dashboard provides insights into API server severity events and trends, autoscaler and status code trends, top problem URLs, and a list of recent error messages.
Use this dashboard to:
Understand the status codes of requests made to Kube API Server.
Review the top 10 URLs with problem status codes.
Review the severity of various Kube API Server events, and analyze any fatal or erroneous events of Kube API Server operations.
Find spikes or abnormal activity in the status codes of auto-scaler operations.
The AKS Scheduler dashboard provides a high-level view of severity types and trends for the Kube scheduler, as well as a detailed list of error messages.
Use this dashboard to:
Find the severity of various Kube scheduler events.
Analyze fatal or erroneous events of Kube scheduler operations.


/AKS_Controller_Manager.png)
/AKS_API_Server.png)
/AKS_Scheduler.png)