Manage Azure Native New Relic Service
Resource overview
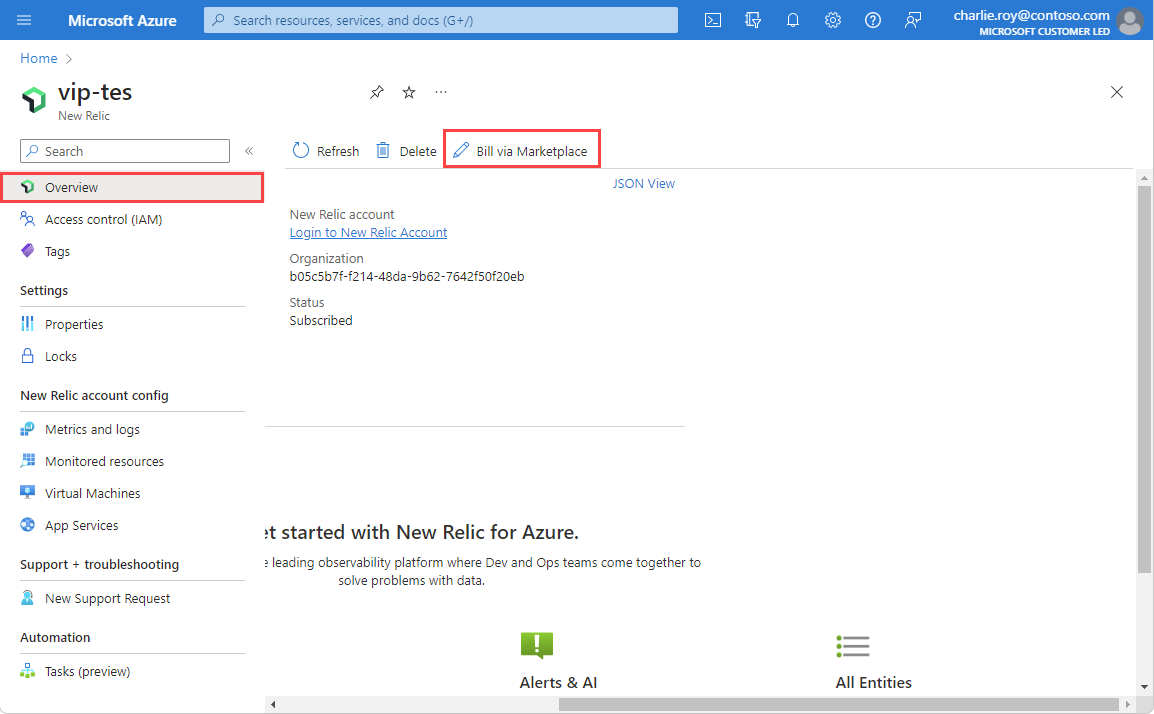
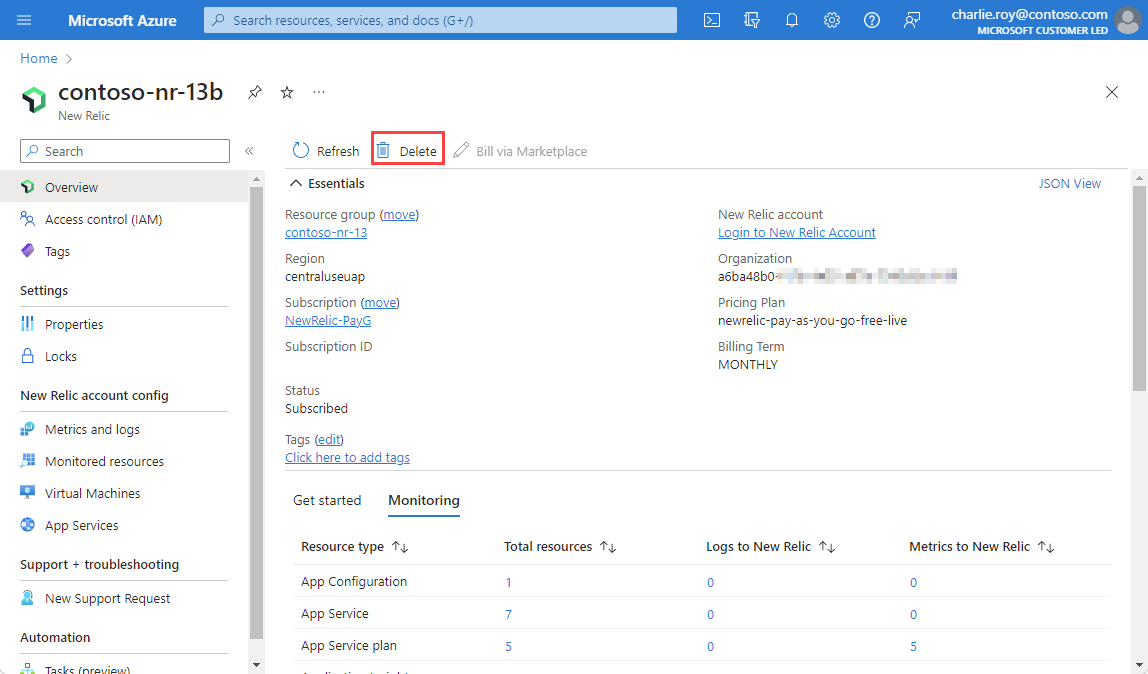
To see the details of your New Relic resource, select Overview on the left pane.
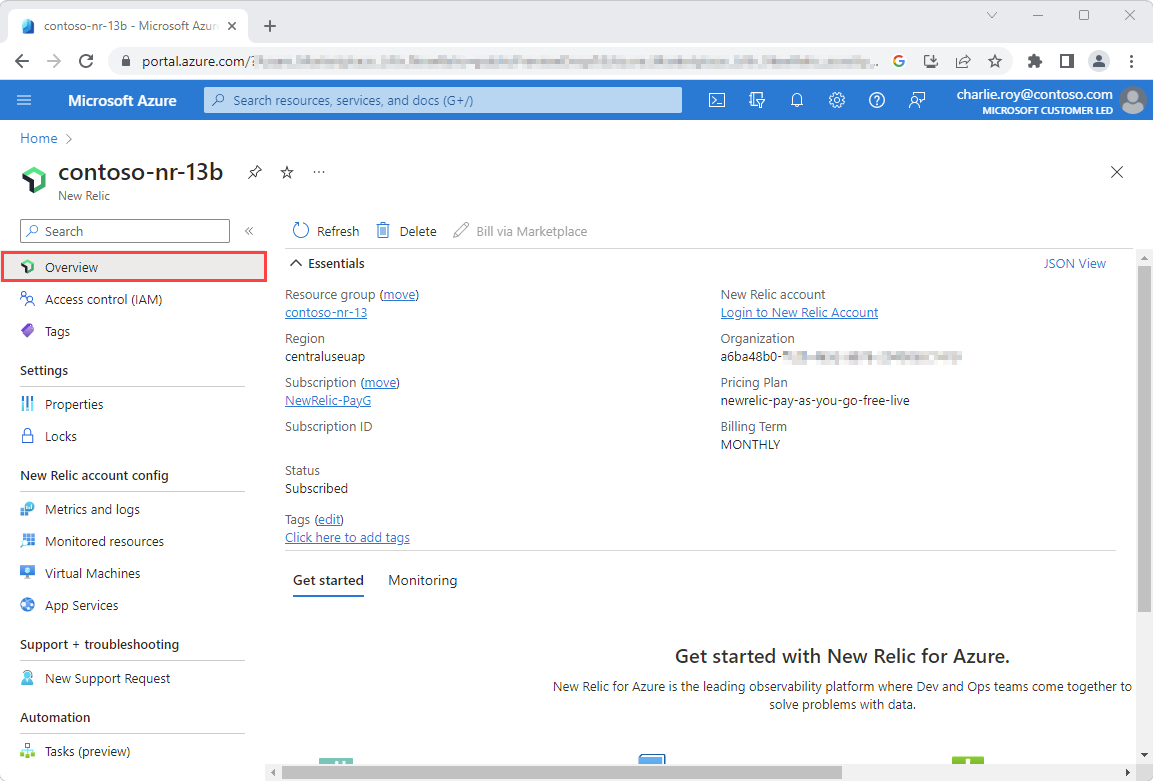
The details include:
- Resource group
- Region
- Subscription
- Tags
- New Relic account
- New Relic organization
- Status
- Pricing plan
- Billing term
At the bottom:
- The Get started tab provides deep links to New Relic dashboards, logs, and alerts.
- The Monitoring tab provides a summary of the resources that send logs and metrics to New Relic.
If you select Monitored resources, the pane that opens includes a table with information about the Azure resources that are sending logs and metrics to New Relic.
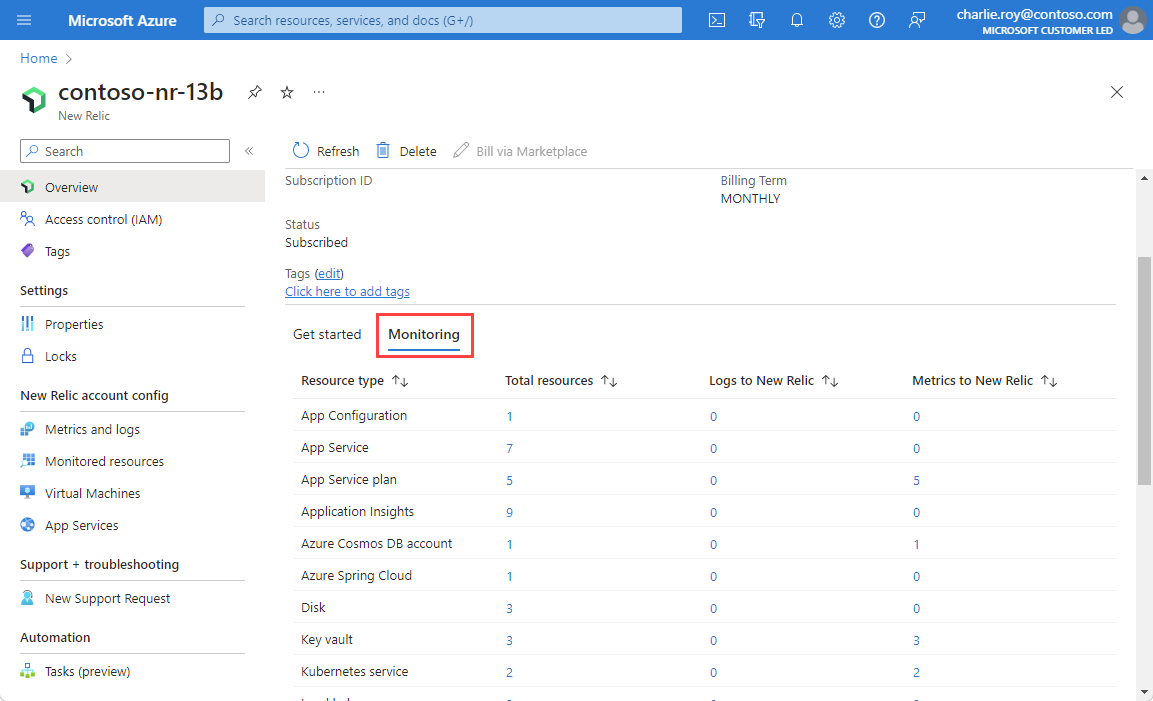
The columns in the table denote valuable information for your resource:
| Property | Description |
|---|---|
| Resource type | Azure resource type |
| Total resources | Count of all resources for the resource type |
| Logs to New Relic | Count of logs for the resource type |
| Metrics to New Relic | Count of resources that are sending metrics to New Relic through the integration |
If New Relic currently manages billing and you want to change to Azure Marketplace billing to consume your Azure commitment, you should work with New Relic to align on timeline as per the current contract tenure. Then, switch your billing using the Bill via Marketplace from the working pane of the Overview page or your New Relic resource.
Reconfigure rules for logs or metrics
To change the configuration rules for logs or metrics, select Metrics and Logs in the Resource menu.
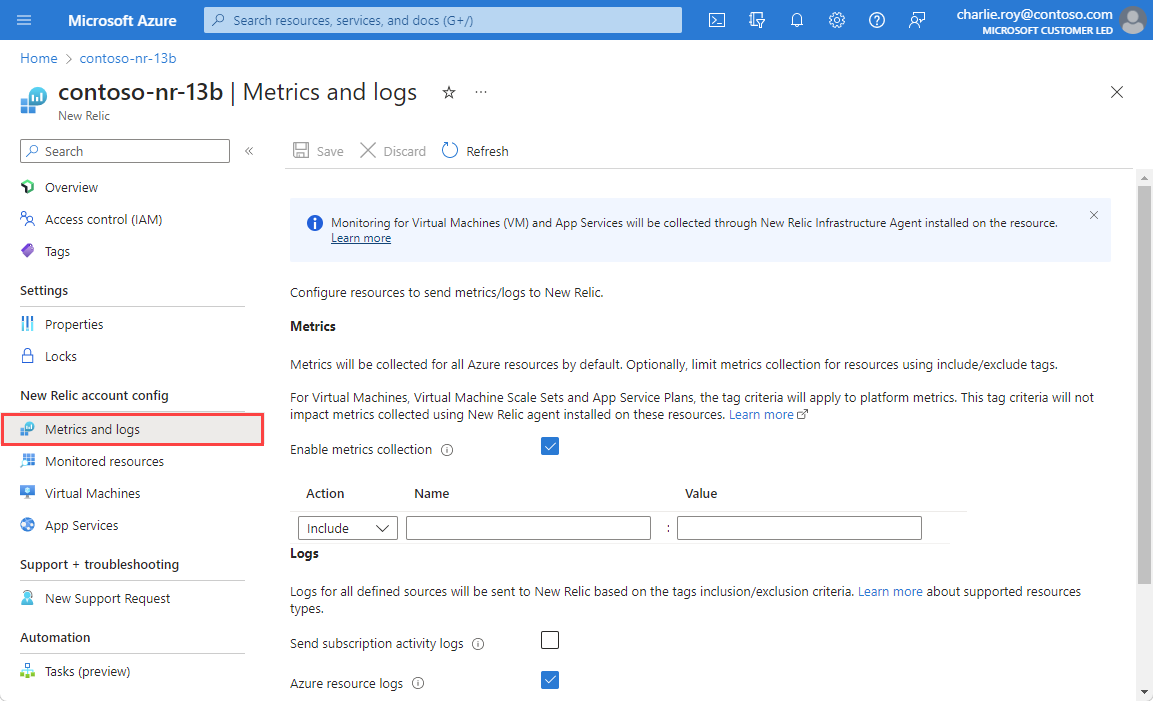
For more information, see Configure metrics and logs.
View monitored resources
To see the list of resources that are sending metrics and logs to New Relic, select Monitored resources on the left pane.
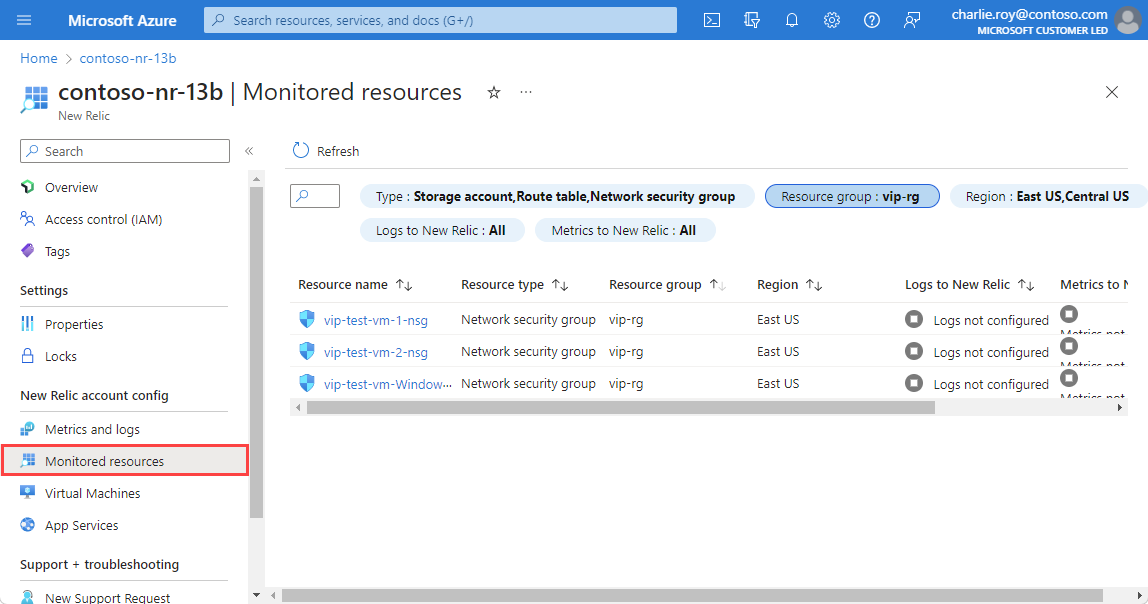
You can filter the list of resources by resource type, resource group name, region, and whether the resource is sending metrics and logs.
The column Logs to New Relic indicates whether the resource is sending logs to New Relic. If the resource isn't sending logs, the reasons could be:
- Resource does not support sending logs: Only resource types with monitoring log categories can be configured to send logs. See Supported categories.
- Limit of five diagnostic settings reached: Each Azure resource can have a maximum of five diagnostic settings. For more information, see Diagnostic settings.
- Error: The resource is configured to send logs to New Relic but an error blocked it.
- Logs not configured: Only Azure resources that have the appropriate resource tags are configured to send logs to New Relic.
- Agent not configured: Virtual machines or app services without the New Relic agent installed don't send logs to New Relic.
The column Metrics to New Relic indicates whether New Relic is receiving metrics that correspond to this resource.
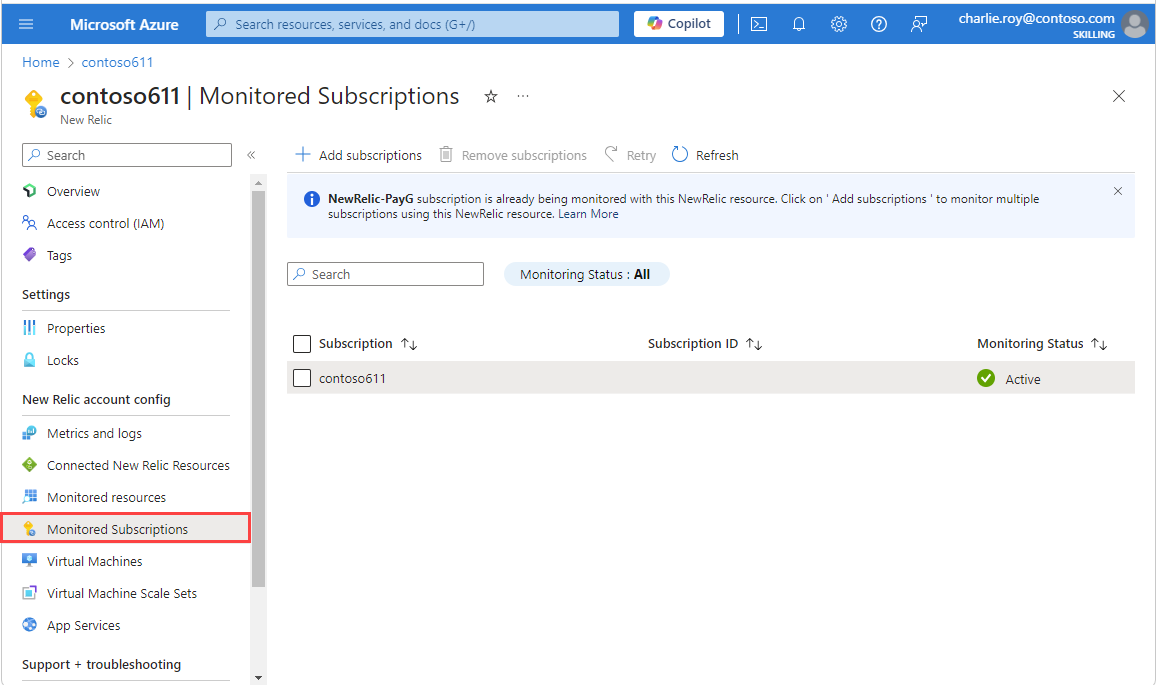
Monitor multiple subscriptions
You can now monitor all your subscriptions through a single New Relic resource using Monitored Subscriptions. Your experience is simplified because you don't have to set up a New Relic resource in every subscription that you intend to monitor. You can monitor multiple subscriptions by linking them to a single New Relic resource that is tied to a New Relic organization. This provides a single pane view for all resources across multiple subscriptions.
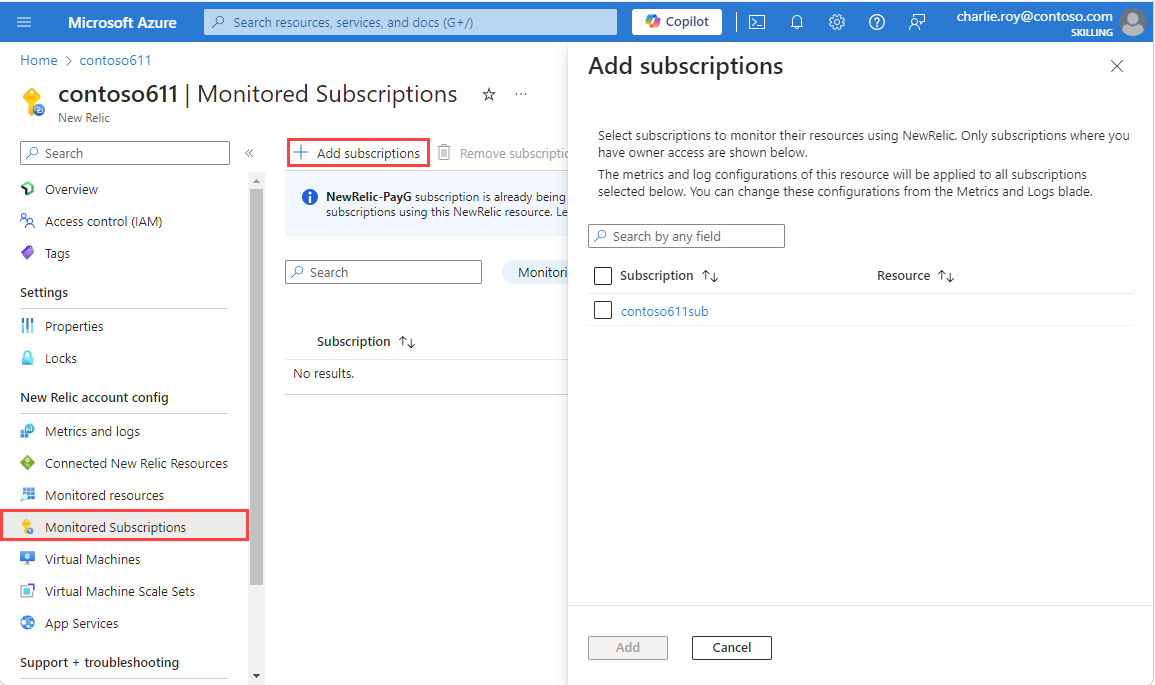
To manage multiple subscriptions that you want to monitor, select Monitored Subscriptions in the New Relic New Relic organization configurations section of the Resource menu.
From Monitored Subscriptions in the Resource menu, select the Add Subscriptions. The Add Subscriptions experience that opens and shows the subscriptions you have Owner role assigned to and any New Relic resource created in those subscriptions that is already linked to the same New Relic organization as the current resource.
If the subscription you want to monitor has a resource already linked to the same New Relic org, we recommended that you delete the New Relic resources to avoid shipping duplicate data, and incurring double the charges.
Select the subscriptions you want to monitor through the New Relic resource and select Add.
If the list doesn’t get updated automatically, select Refresh to view the subscriptions and their monitoring status. You might see an intermediate status of In Progress while a subscription gets added. When the subscription is successfully added, you see the status is updated to Active. If a subscription fails to get added, Monitoring Status shows as Failed.

The set of tag rules for metrics and logs defined for the New Relic resource apply to all subscriptions that are added for monitoring. Setting separate tag rules for different subscriptions isn't supported. Diagnostics settings are automatically added to resources in the added subscriptions that match the tag rules defined for the New Relic resource.
If you have existing New Relic resources that are linked to the account for monitoring, you can end up with duplication of logs that can result in added charges. Ensure you delete redundant New Relic resources that are already linked to the account. You can view the list of connected resources and delete the redundant ones. We recommended to consolidate subscriptions into the same New Relic resource where possible.
The tag rules and logs that you defined for the New Relic resource are applied to all the subscriptions that you select to be monitored. If you would like to reconfigure the tag rules, you can follow the steps described here.
For more information about the following capabilities, see Monitor Virtual Machines using the New Relic agent and Monitor App Services using the New Relic agent.
Connected New Relic resources
To access all New Relic resources and deployments you created using the Azure or New Relic portal experience, go to the Connected New Relic resources tab in any of your Azure New Relic resources.
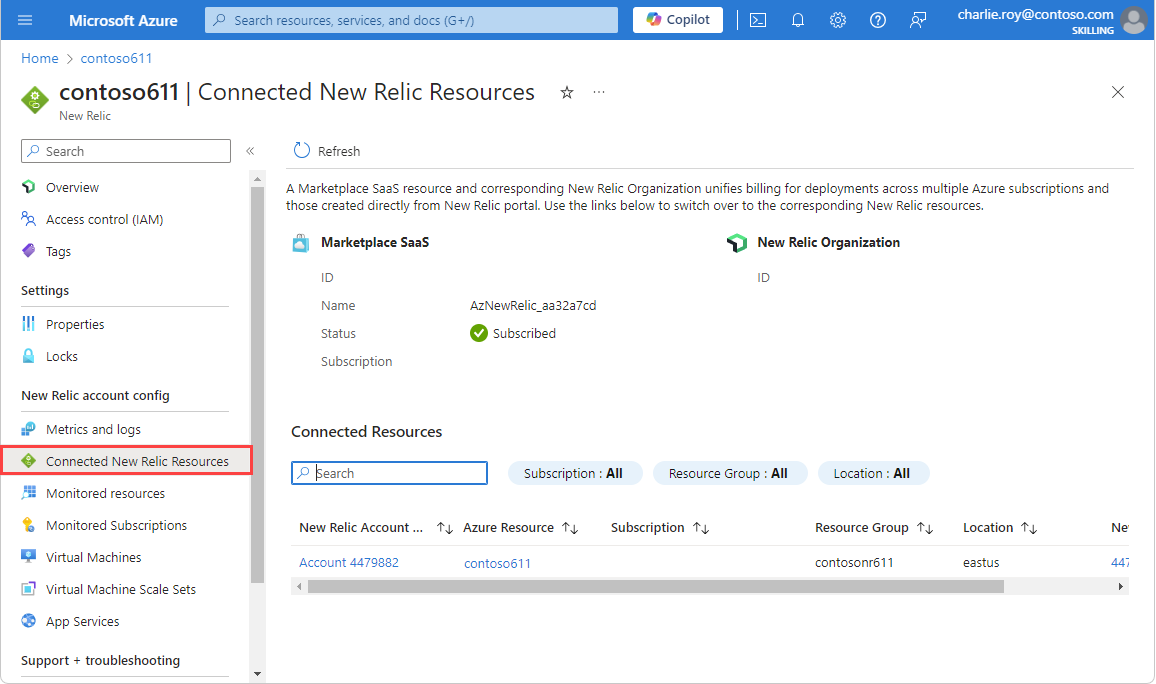
You can easily manage the corresponding New Relic deployments or Azure resources using the links, provided you have owner or contributor rights to those deployments and resources.
Monitor virtual machines by using the New Relic agent
You can install the New Relic agent on virtual machines as an extension. Select Virtual Machines on the left pane. The Virtual machine agent pane shows a list of all virtual machines in the subscription.
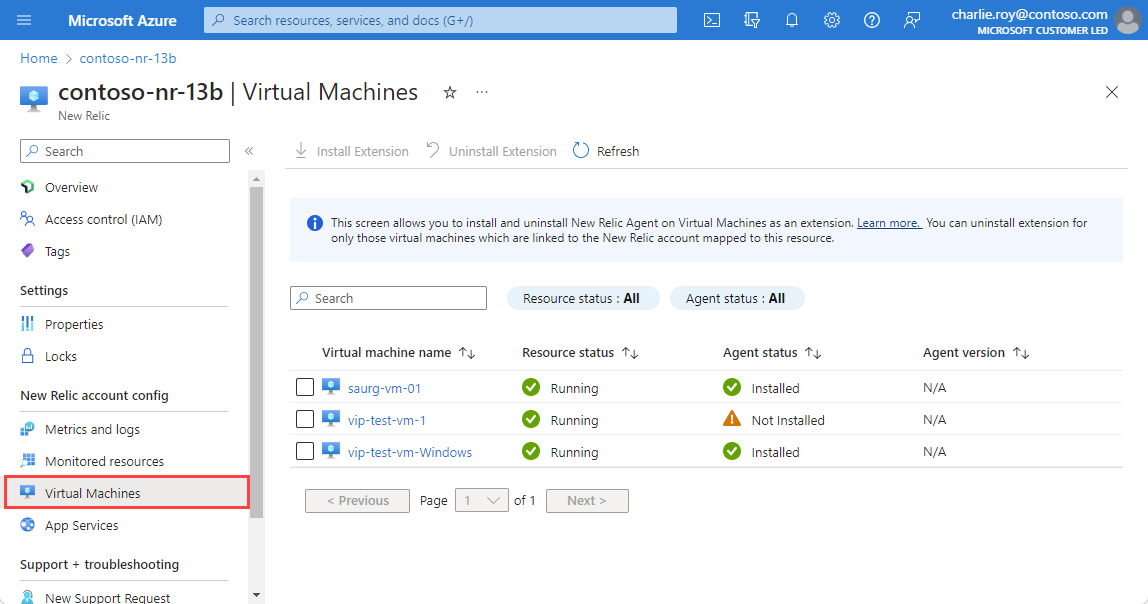
For each virtual machine, the following info appears:
| Property | Description |
|---|---|
| Virtual machine name | Name of the virtual machine. |
| Resource status | Indicates whether the virtual machine is stopped or running. The New Relic agent can be installed only on virtual machines that are running. If the virtual machine is stopped, installing the New Relic agent is disabled. |
| Agent status | Indicates whether the New Relic agent is running on the virtual machine. |
| Agent version | Version number of the New Relic agent. |
Monitor Azure Virtual Machine Scale Sets by using the New Relic agent
You can install New Relic agent on Azure Virtual Machine Scale Sets as an extension.
- Select Virtual Machine Scale Sets under New Relic account config in the Resource menu.
- In the working pane, you see a list of all virtual machine scale sets in the subscription.
Virtual Machine Scale Sets is an Azure Compute resource that can be used to deploy and manage a set of identical VMs. For more information, see Virtual Machine Scale Sets.
For more information on the orchestration modes available orchestration modes.
Use native integration to install an agent on both the uniform and flexible scale-sets. The new instances (VMs) of a scale set, in any mode, receive the agent extension during scale-up. Virtual Machine Scale Sets resources in a uniform orchestration mode support Automatic, Rolling, and Manual upgrade policy. Resources in Flexible orchestration mode only support manual upgrade.
If a manual upgrade policy is set for a resource, upgrade the instances manually by installing the agent extension for the already scaled up instances. For more information on autoscaling and instance orchestration, see autoscaling-and-instance-orchestration.
Monitor app services by using the New Relic agent
You can install the New Relic agent on app services as an extension. Select App Services on the left pane. The working pane shows a list of all app services in the subscription.
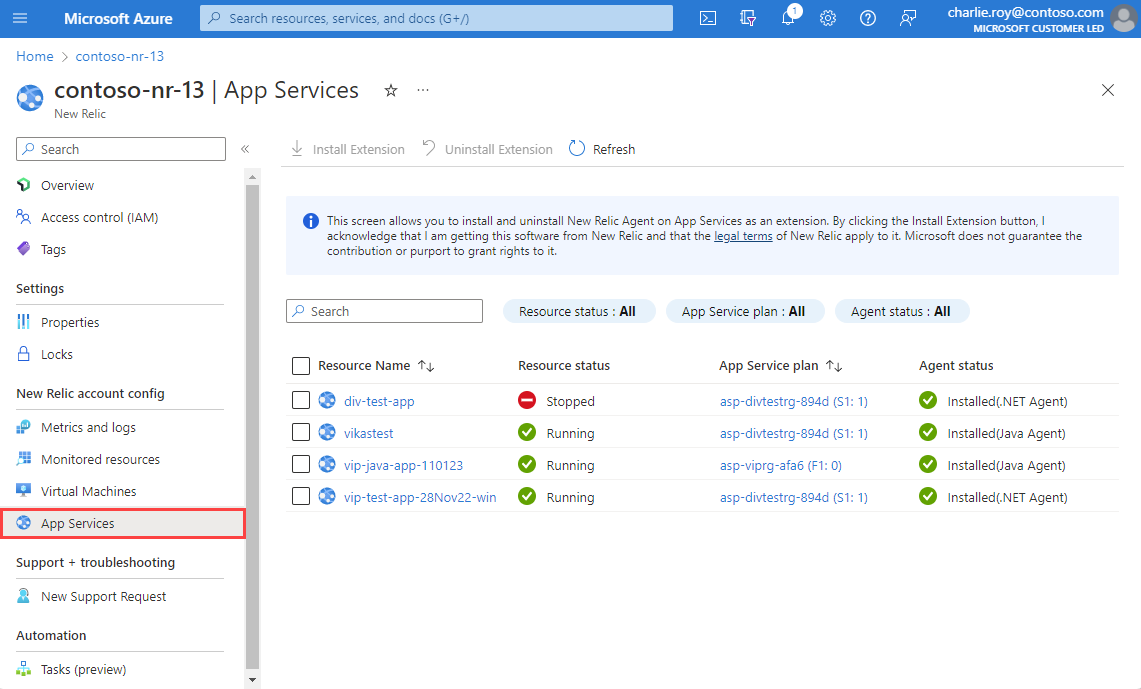
For each app service, the following information appears:
| Property | Description |
|---|---|
| Resource name | App service name. |
| Resource status | Indicates whether the App service is running or stopped. The New Relic agent can be installed only on app services that are running. |
| App Service plan | The plan configured for the app service. |
| Agent status | Status of the agent. |
To install the New Relic agent, select the app service and then select Install Extension. The application settings for the selected app service are updated, and the app service is restarted to complete the configuration of the New Relic agent.
Delete a New Relic resource
Select Overview on the left pane. Then, select Delete.
Confirm that you want to delete the New Relic resource. Select Delete.
If only one New Relic resource is mapped to a New Relic account, logs and metrics are no longer sent to New Relic.
For a New Relic organization where billing is managed through Azure Marketplace, deleting the last associated New Relic resource also removes the corresponding Azure Marketplace billing relationship.
If you map more than one New Relic resource to the New Relic account by using the link option, deleting the New Relic resource only stops sending logs for Azure resources associated with that New Relic resource. Because other Azure Native New Relic Service resources are linked with this New Relic account, billing continues through Azure Marketplace.